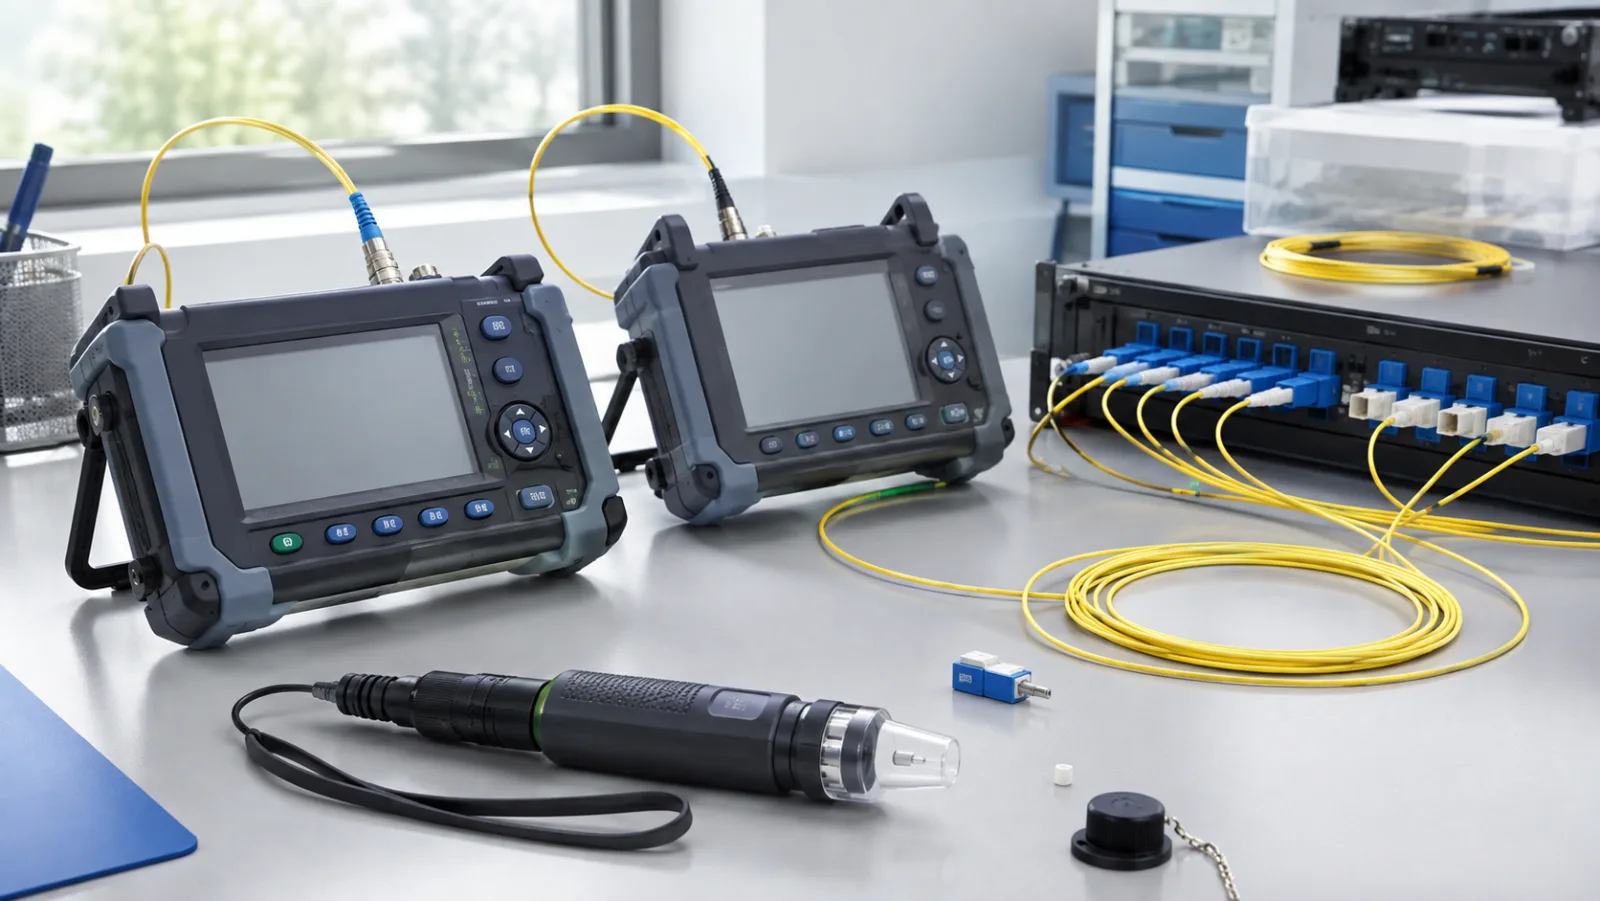
What Is Fiber Optic Troubleshooting?
Fiber optic troubleshooting is the systematic process of identifying, isolating, and resolving faults in a fiber optic network. It combines precise measurement, logical deduction, and an understanding of optical physics to restore signal integrity and minimize downtime. Unlike copper networks, where electrical continuity and voltage levels are primary indicators, fiber optics require attention to light loss, reflectance, and wavelength-specific behavior. Effective troubleshooting not only fixes the immediate problem but also reveals underlying design or maintenance issues that could cause future failures.
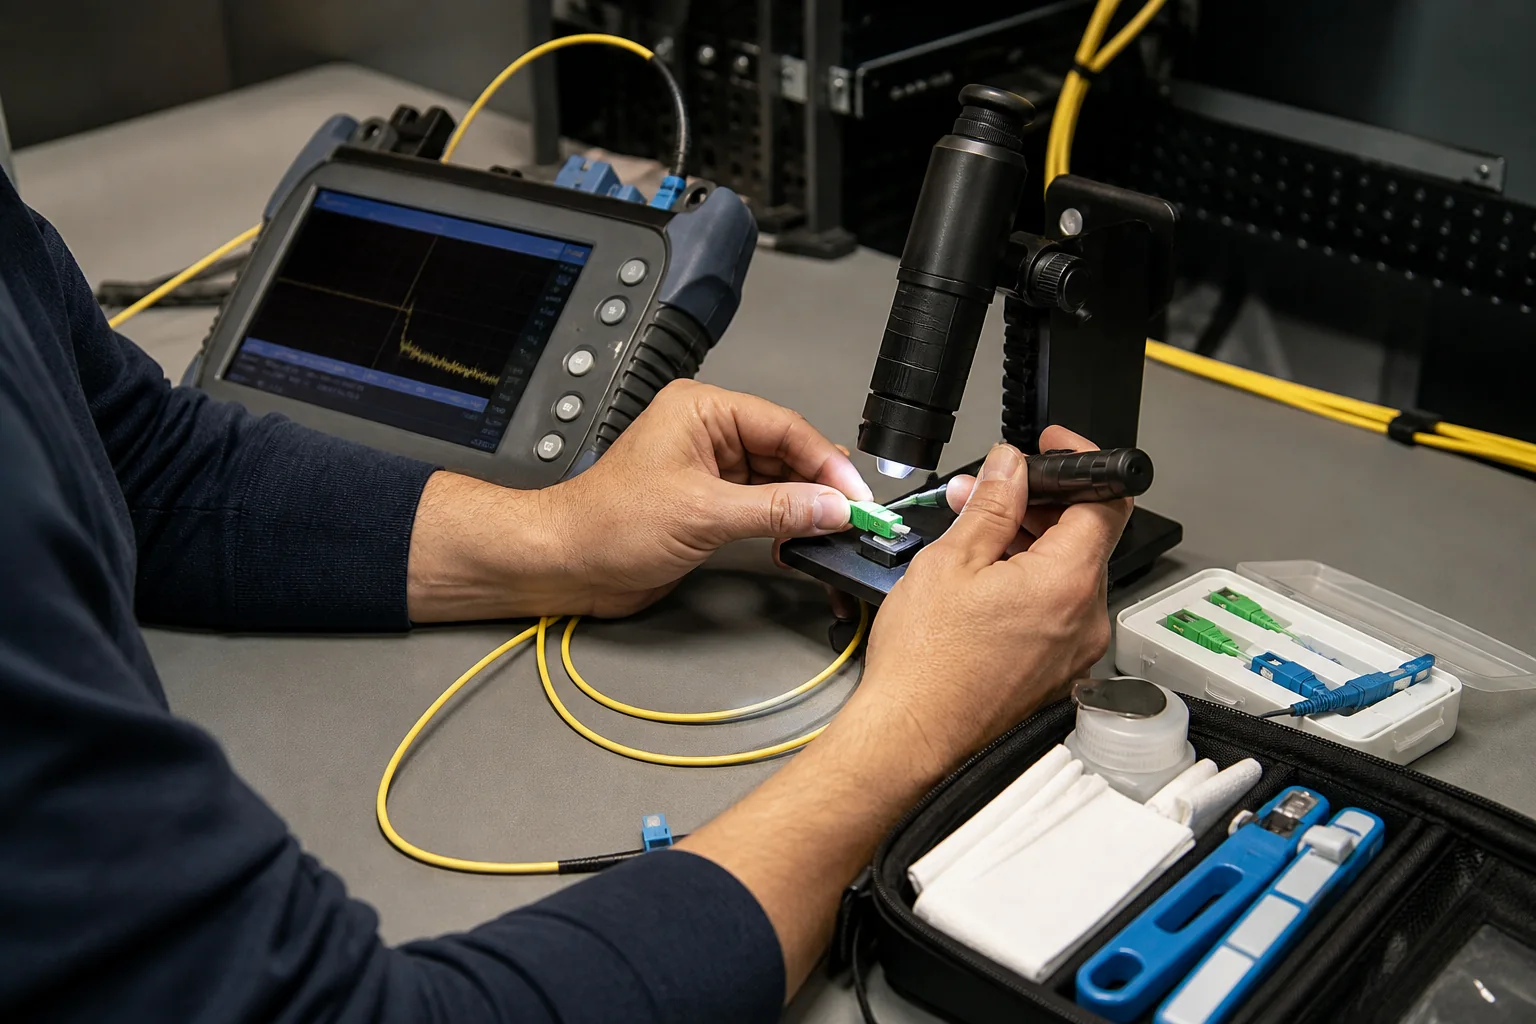
This guide provides a structured approach to fiber optic troubleshooting, from foundational definitions to advanced diagnostic techniques. Whether you are a field technician, network engineer, or operations manager, you will learn how to interpret test results, choose the right tools, and implement preventive maintenance strategies.
Core Concepts and Terminology
Before diving into troubleshooting procedures, you must master the language of fiber optics. These terms form the basis of every diagnostic conversation and test report.
Optical Power and Loss
Optical power is the amount of light energy transmitted through the fiber, measured in decibels relative to one milliwatt (dBm). Loss, also called attenuation, is the reduction in optical power as light travels through the fiber, connectors, splices, and other components. Loss is expressed in decibels (dB) and is always a positive number when referring to the amount of signal decrease. In troubleshooting, you compare measured loss against a calculated link loss budget to determine if the system is within acceptable limits.
Insertion Loss and Return Loss
Insertion loss is the loss introduced by inserting a component (like a connector or splice) into the path. Return loss, also known as reflectance, measures how much light is reflected back toward the source due to impedance mismatches or imperfections. High return loss (i.e., a low negative number in dB) is desirable because reflections can disrupt laser operation and cause signal degradation. For example, a return loss of -50 dB is better than -20 dB.
OTDR and Power Meter
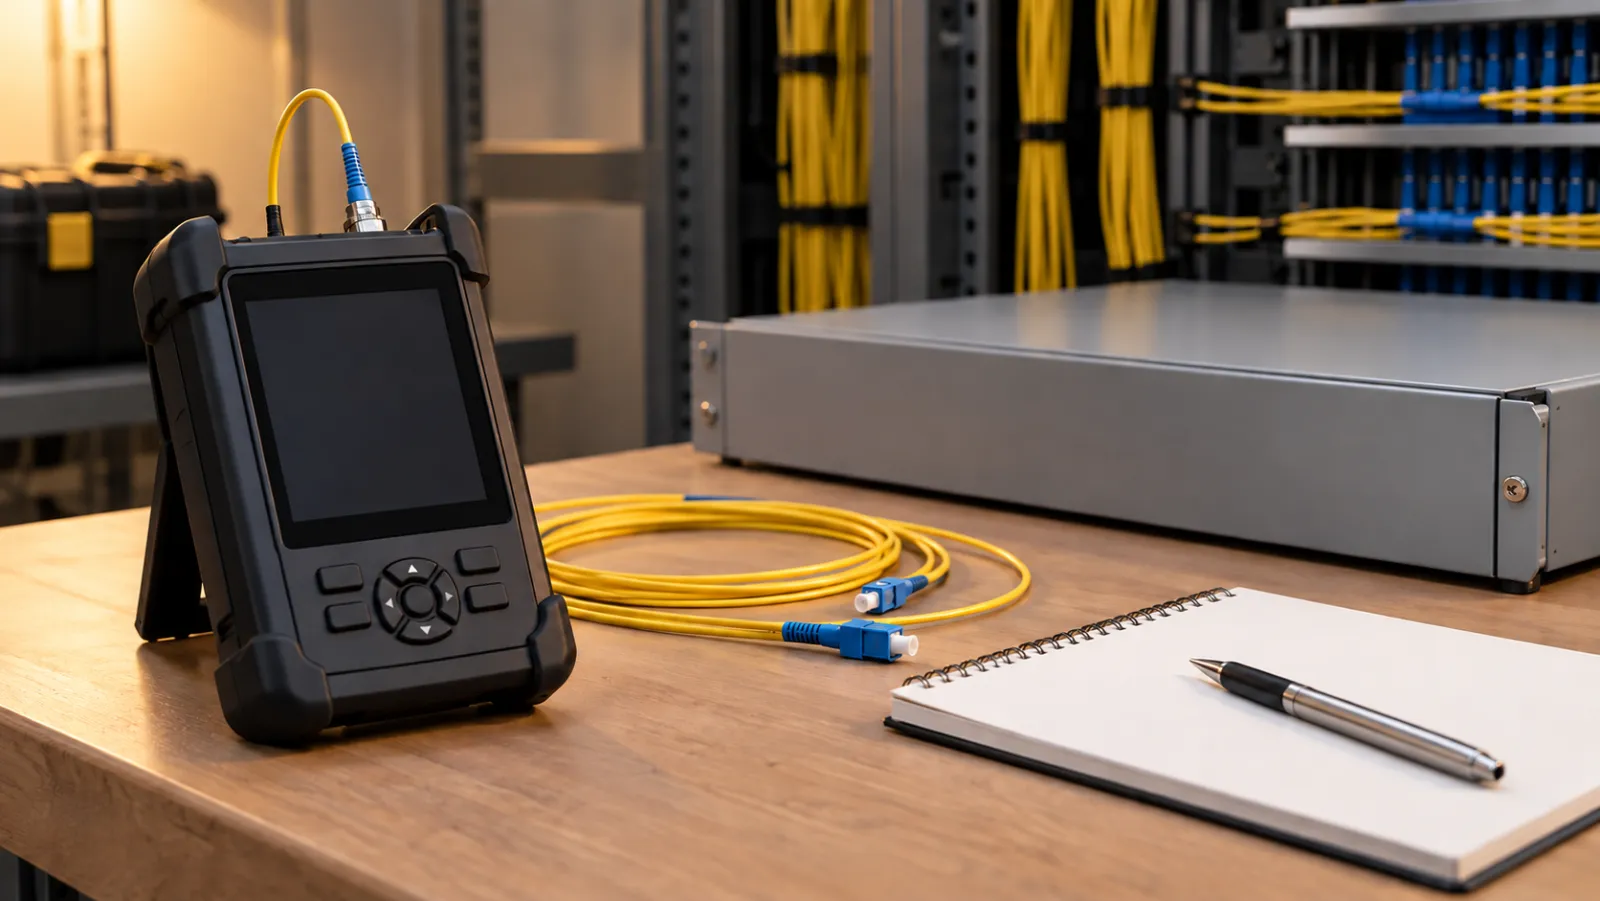
An Optical Time-Domain Reflectometer (OTDR) is a key troubleshooting tool that sends a light pulse into the fiber and analyzes the backscattered light to create a trace of loss and reflectance along the link. A power meter measures the absolute optical power at a given point, often used with a light source to perform end-to-end loss measurements. Both tools are indispensable, but they serve different purposes: OTDR for locating faults, power meter for verifying link performance.
Wavelength and Mode
Fiber optic systems operate at specific wavelengths, typically 850 nm, 1300 nm, 1310 nm, 1490 nm, 1550 nm, or 1625 nm, depending on the application and fiber type. Multimode fiber (MMF) supports multiple light modes and is used for short distances, while single-mode fiber (SMF) supports a single mode for long-haul links. Troubleshooting must account for wavelength-dependent loss and dispersion.
The Role of Fiber in a Network
Fiber optic cabling forms the physical backbone of modern telecommunications, data centers, and enterprise networks. It carries vast amounts of data over long distances with low latency and immunity to electromagnetic interference. However, its performance depends on the integrity of every component in the optical path: transmitters, connectors, splices, patch panels, and receivers. A fault in any of these can cause packet loss, increased bit error rates, or complete link failure.
In a typical network, fiber links connect switches, routers, and servers, often in a star, ring, or mesh topology. Troubleshooting must consider the entire path, not just the visible fiber cable. For instance, a dirty connector at a patch panel can cause intermittent errors that are difficult to trace without proper inspection.
Key Engineering Decisions in Troubleshooting
When a fiber link fails, you must make several critical decisions that affect the speed and accuracy of your diagnosis. These decisions are not always straightforward and require a balance between thoroughness and operational urgency.
Choosing the Right Test Equipment
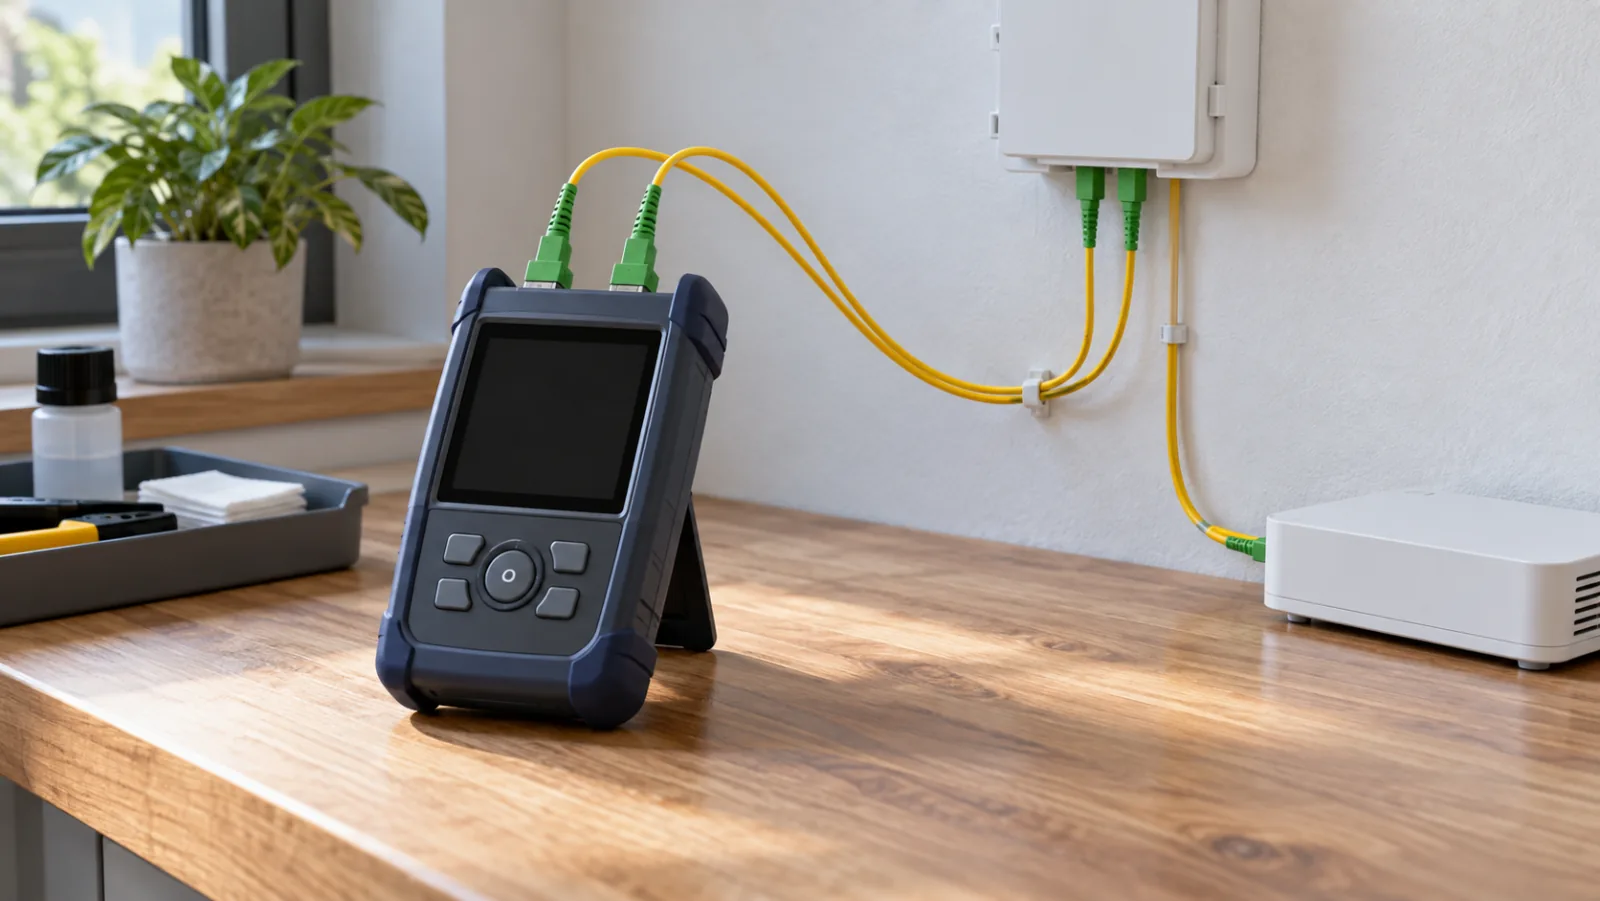
Your choice of test equipment depends on the nature of the problem. For a quick continuity check, a visual fault locator (VFL) that emits a visible red laser can identify breaks or bends. For quantitative loss measurement, you need a light source and power meter (LSPM). For locating faults and assessing splice quality, an OTDR is essential. In high-density environments, an optical probe or fiber inspection microscope is critical for checking connector end faces, as contamination is a leading cause of failure.
Deciding Between Live and Dead Testing
Testing a live fiber (one carrying traffic) requires specialized tools like a live fiber identifier or a power meter with a live fiber adapter, which can detect signal presence without interrupting service. Dead testing, where the link is taken out of service, allows for more comprehensive measurements using OTDR and LSPM. The decision hinges on whether the service can tolerate downtime and whether you have the proper safety equipment to avoid eye damage from laser emissions.
Interpreting Test Results Against Standards
Fiber optic testing is governed by industry standards such as those from the TIA (Telecommunications Industry Association) and ISO/IEC. These standards specify maximum insertion loss for connectors (typically 0.75 dB for single-mode, but this can vary), minimum return loss values, and test procedures. However, standards are normative requirements—they must be met for compliance—but typical engineering values may be stricter. For example, a well-polished connector might achieve 0.3 dB loss, which is better than the standard’s maximum. When troubleshooting, you should compare your measurements to both the standard and the manufacturer’s specifications for the components in your link.
Prioritizing Faults by Severity
Not all faults are equal. A complete fiber break is obvious and critical, but a gradual increase in loss due to macrobending or contamination may be intermittent. You must decide whether to fix the immediate issue or investigate the root cause. For instance, if an OTDR trace shows a high-loss event at a splice, you might re-splice it, but if the loss is due to excessive bending, you may need to reroute the cable. This decision affects long-term reliability.
Documenting and Reporting
Finally, you must decide how to document your findings. Accurate records of test results, including OTDR traces and power meter readings, are essential for future troubleshooting and for verifying that repairs meet specifications. You should also note the date, time, weather conditions (if outdoor), and any changes made. This documentation becomes part of the network’s maintenance history and helps identify recurring issues.
In summary, fiber optic troubleshooting is a disciplined process that requires a solid grasp of optical principles, familiarity with testing tools, and the ability to make informed decisions under pressure. The following sections of this guide will delve deeper into specific fault types, step-by-step procedures, and preventive maintenance strategies to help you master this critical skill.
Fiber Optic Network Architectures and Their Troubleshooting Implications
Fiber optic troubleshooting is not a one-size-fits-all process. The architecture of the network—how fibers are deployed, connected, and terminated—determines which faults are likely, which test methods are appropriate, and how results should be interpreted. This section outlines the major fiber optic architectures you will encounter in the field, along with their specific maintenance and troubleshooting characteristics.
Point-to-Point Links
The simplest architecture is a direct fiber connection between two endpoints, such as a switch and a server, or between two buildings. In a point-to-point link, the entire path is a single continuous fiber or a series of spliced fibers with connectors at each end. Troubleshooting is straightforward: you test the entire link from one end, and if loss is excessive, you isolate the fault using an OTDR. Common issues include dirty connectors, damaged patch cords, and macro-bends near termination points.
Passive Optical Networks (PON)
PONs are widely used in fiber-to-the-home (FTTH) and fiber-to-the-building (FTTB) deployments. A single optical line terminal (OLT) at the central office feeds multiple optical network units (ONUs) through passive splitters. The splitter divides the optical signal, typically in a 1:32 or 1:64 ratio, which introduces inherent loss. Troubleshooting a PON requires understanding splitter loss and the fact that a fault on one branch can affect others if it causes back-reflections. Testing often involves using a power meter at the ONU and an OTDR from the OLT to locate breaks or excessive loss in specific branches.
Dense Wavelength Division Multiplexing (DWDM) Systems
DWDM systems transmit multiple wavelengths over a single fiber, greatly increasing capacity. Troubleshooting these systems adds a layer of complexity because each wavelength can have different loss characteristics, and components like multiplexers, demultiplexers, and optical add-drop multiplexers (OADMs) introduce wavelength-dependent loss. Testing typically requires a tunable light source and a power meter, or an optical spectrum analyzer, to verify that each channel is within its loss budget. OTDR testing is still useful for locating physical faults, but the interpretation must account for the presence of DWDM components.
Hybrid Fiber-Coaxial (HFC) Networks
HFC networks combine fiber and coaxial cable, commonly used in cable television and broadband. The fiber portion runs from the headend to a fiber node, where the signal is converted to electrical and distributed via coax. Troubleshooting focuses on the fiber segment, which is usually a point-to-point or a simple star topology. Key issues include connector contamination at the node and excessive loss due to poor splicing or aging fiber.
Architecture Comparison Table
| Architecture | Typical Topology | Common Faults | Primary Test Methods | Loss Budget Considerations |
|---|---|---|---|---|
| Point-to-Point | Direct fiber link | Dirty connectors, breaks, macro-bends | Power meter, OTDR | Simple; each connection adds loss |
| PON | Tree with passive splitters | Splitter failure, branch breaks, dirty connectors at ONU | Power meter, OTDR from OLT | Splitter loss is significant; must account for split ratio |
| DWDM | Point-to-point or ring with mux/demux | Wavelength-dependent loss, component failure, fiber breaks | Tunable source, power meter, OSA, OTDR | Each channel has its own budget; components add loss per wavelength |
| HFC | Star from headend to nodes | Connector contamination at node, splicing issues | Power meter, OTDR | Fiber segment loss plus node conversion losses |
Selecting the Right Architecture for Your Network
Choosing an architecture is a strategic decision that affects not only initial cost but also long-term maintenance and troubleshooting efficiency. Here are key selection criteria:
- Bandwidth and Scalability: If future growth is expected, DWDM offers high scalability but requires more sophisticated testing equipment. PON is cost-effective for residential services but has limited bandwidth per user.
- Distance and Loss Budget: Point-to-point links can span longer distances with lower loss, while PONs are limited by splitter loss. Calculate the total loss budget based on the components and fiber length.
- Maintenance Capability: Consider your team’s expertise. PONs require specialized OTDR skills to interpret splitter reflections. DWDM demands knowledge of wavelength-specific testing.
- Redundancy and Reliability: Ring topologies (common in DWDM) provide redundancy but complicate troubleshooting. Point-to-point is simple but offers no automatic failover.
Performance Limits and Design Tradeoffs
Every architecture has inherent performance limits that influence troubleshooting. Understanding these limits helps you set realistic expectations and avoid chasing non-existent faults.
Optical Loss Budgets
The loss budget is the maximum allowable attenuation between transmitter and receiver. It is typically specified by the equipment manufacturer and includes connector loss, splice loss, and fiber attenuation. Standards such as those from the TIA/EIA provide guidelines for maximum loss per connector (typically 0.5 dB for single-mode, but this is a typical value, not a normative requirement—always refer to the specific standard or project specification). In practice, you should measure the actual loss and compare it to the budget. If the measured loss exceeds the budget, you have a fault to find.
Dispersion and Bandwidth
In high-speed systems, dispersion—the spreading of optical pulses—limits the maximum data rate and distance. Chromatic dispersion (CD) and polarization mode dispersion (PMD) are critical in long-haul and DWDM systems. Troubleshooting dispersion issues requires specialized test equipment like a dispersion analyzer. Design tradeoffs include using dispersion-compensating fiber or electronic dispersion compensation, which add cost and complexity.
Return Loss and Reflections
Return loss is the ratio of incident power to reflected power, expressed in dB. High reflections can destabilize laser sources and cause signal degradation. In PONs, reflections from bad connectors can create ghost signals on the OTDR trace. Standards often specify minimum return loss (e.g., 26 dB for single-mode connectors, but again, this is a typical value). Design tradeoffs involve using angled physical contact (APC) connectors to reduce reflections, but these require different cleaning procedures.
Environmental Factors
Temperature, moisture, and physical stress affect fiber performance. For example, water ingress can cause hydrogen darkening, increasing attenuation. Design tradeoffs include using gel-filled cables or armored fiber for harsh environments, which are more expensive but reduce maintenance issues.
In summary, the choice of architecture is a balance between performance, cost, and maintainability. Understanding the tradeoffs enables you to design a network that is easier to troubleshoot and maintain over its lifetime.
Planning Calculations: Building a Budget That Works in the Field
Before a single splice is made, the link budget must be calculated. This is not a paperwork exercise—it is the foundation of every later troubleshooting decision. A budget that is too tight will produce intermittent failures; one that is too loose may hide a developing fault until it is critical.
From Theory to Real-World Numbers
Start with the manufacturer’s datasheet values for attenuation, connector loss, and splice loss. Then add a margin for aging, temperature swings, and future repairs. Typical engineering practice adds 2–3 dB of system margin, but this is not a standard requirement—it depends on the application and the customer’s risk tolerance. For long-haul or high-availability links, a larger margin is common.
When calculating, use the worst-case values, not the typical ones. For example, if a connector datasheet says 0.2 dB typical and 0.5 dB maximum, use 0.5 dB in your budget. This prevents surprises during acceptance testing.
Field Example: The 10 km Link That Never Passed
A technician once installed a 10 km single-mode link using pre-terminated patch cords. The budget looked fine on paper: 0.4 dB/km × 10 km = 4 dB, plus 6 connectors × 0.5 dB = 3 dB, plus 2 splices × 0.3 dB = 0.6 dB, total 7.6 dB. The receiver sensitivity was –20 dBm, and the transmitter output was –3 dBm, leaving a 9.4 dB margin. Yet the link failed intermittently.
Investigation revealed that the patch cords were not the specified type—they had higher insertion loss than the datasheet claimed. Also, one connector was damaged due to improper cleaning. The actual loss was 11 dB, leaving only 6 dB margin, which was insufficient during temperature extremes. The fix was to replace the substandard cords and clean all end faces.
Lesson: Always verify the actual components, not just the datasheet. A budget is only as good as the assumptions behind it.
Installation Implications: Where Faults Are Born
Many fiber optic troubleshooting issues originate during installation. Poor practices create latent defects that surface months later. Understanding these implications helps you prevent faults and diagnose them faster.
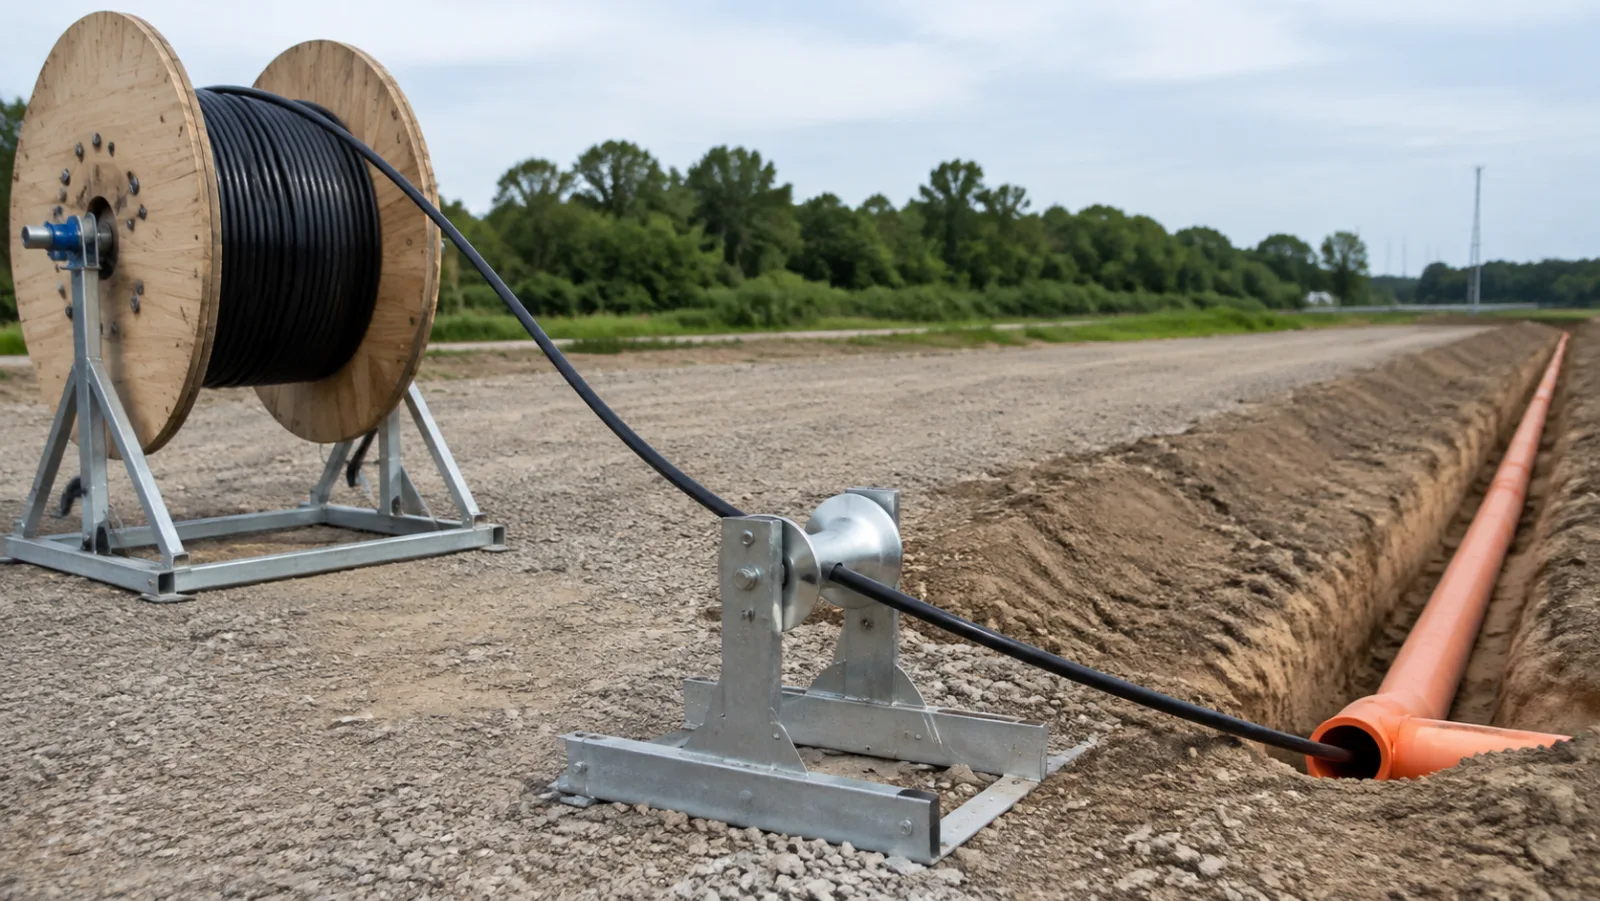
Cable Handling and Bend Radius
Exceeding the minimum bend radius during installation is a common cause of micro-bends and macrobends. These do not always show up immediately—they can cause gradual loss increase over time as the cable settles. Always follow the manufacturer’s recommended bend radius for both installation and long-term operation. The installation radius is typically larger than the operational one.
During pulling, avoid sharp edges and use proper guides. A kink in the cable can cause permanent damage that is difficult to locate without OTDR.
Connector and Splice Quality
Connector end-face contamination is the number one cause of field failures. Even a tiny dust particle can cause reflection and loss. Use a microscope to inspect every connector before mating. Clean with appropriate tools—dry cleaning is often sufficient, but wet cleaning may be needed for stubborn contamination.
Splices must be protected in splice trays with proper strain relief. A poorly protected splice can break or degrade over time. Always test each splice with an OTDR before closing the tray.
Field Example: The Intermittent PON Drop
In a PON deployment, a subscriber’s drop cable was routed through a conduit with a sharp bend. The bend was within the operational radius but close to the limit. Over months, the cable shifted and the bend became tighter, causing a 3 dB loss increase. The ONT reported low receive power, but only during certain temperatures. An OTDR trace showed a sharp loss event at the bend location. The fix was to re-route the cable with a larger bend.
Lesson: Installation is not just about getting the cable from point A to B—it is about ensuring long-term stability.
Testing and Quality Assurance: Proving the Link Works
Testing is not a single event; it is a process that spans installation, acceptance, and ongoing maintenance. Each phase has different goals and uses different tools.
Installation Testing vs. Acceptance Testing
During installation, you use an OTDR to verify splice quality and locate faults. This is a diagnostic test—you are looking for problems. After installation, you perform acceptance testing to prove the link meets the specified requirements. This typically includes:
- Insertion loss measurement with a light source and power meter (LSPM)
- OTDR testing to document the link’s signature
- Return loss measurement, if required
- Length verification
The acceptance test should be performed end-to-end, using the actual patch cords that will be used in service. This ensures that the entire path is tested, not just the permanent link.
OTDR: The Troubleshooter’s Best Friend
An OTDR sends pulses and measures backscattered light. It provides a graphical trace that shows loss events, reflections, and the overall attenuation. It is essential for locating breaks, bad splices, and excessive bends. However, OTDRs have limitations:
- Dead zones: You cannot see events close to the launch connector.
- Measurement uncertainty: OTDR loss measurements are not as accurate as LSPM measurements.
- Interpretation skill: Reading traces requires experience.
Always use launch and receive cables to move the dead zones out of the link. Use the OTDR to locate faults, but use an LSPM to verify the total loss.
Quality Assurance Documentation
Every test result should be documented. This includes the OTDR trace, loss measurements, and the test equipment used. This documentation is vital for future troubleshooting—it gives you a baseline to compare against. If a link degrades, you can compare the new trace to the original to pinpoint the change.
Store the documentation in a central database, accessible to all maintenance staff. Include the date, tester name, and any relevant notes. This is not just good practice—it is often a contractual requirement.
Field Example: The Case of the Disappearing Margin
An enterprise network had a 2 km multimode link that was installed and tested with a 5 dB margin. A year later, the link began experiencing errors. An OTDR trace showed a 2 dB loss increase at a patch panel. Inspection revealed that a connector had been damaged by repeated unplugging and plugging. The technician replaced the connector and the link returned to normal.
The key to quick resolution was the baseline documentation. Without it, the technician would have had to guess where to look.
Practical Caveats and Common Pitfalls
Even experienced engineers can fall into traps. Here are some practical caveats to keep in mind.
Don’t Trust the OTDR’s Total Loss
The OTDR’s total loss measurement is not the same as the end-to-end loss measured with an LSPM. The OTDR measures loss in both directions, and it may not account for the loss of the launch cable. Always use an LSPM for final acceptance.
Clean Before You Test
Contamination is the most common cause of test failures. Clean all connectors before testing, and inspect them with a scope. A dirty connector can cause a 1–2 dB loss, which may be mistaken for a real fault.
Beware of Wavelength Differences
Testing at 1310 nm and 1550 nm will give different results. Attenuation is lower at 1550 nm, but bend sensitivity is higher. Always test at the wavelength that will be used in service, and document the wavelength in your reports.
Consider the Environment
Temperature, humidity, and vibration can affect test results. If you are testing outdoors, allow the equipment to stabilize. If you are testing a link that will be subject to temperature extremes, test at those extremes if possible.
Final Thought
Fiber optic troubleshooting is as much about prevention as it is about repair. By planning carefully, installing correctly, and testing thoroughly, you can reduce the number of faults and resolve them faster when they occur. The tools and techniques are well established—the key is to use them consistently and document everything.
Failure Modes and Common Mistakes in Fiber Optic Troubleshooting
Even with meticulous installation, fiber optic networks eventually exhibit faults. Understanding the typical failure modes and the mistakes that complicate troubleshooting accelerates resolution and reduces downtime. The most frequent physical causes are contaminated connectors, damaged cables, and faulty splices. However, the most common procedural mistakes are testing without cleaning, misinterpreting OTDR traces, and ignoring environmental factors.
Contamination: The Silent Killer
Dust, oil, and debris on connector end faces are the leading cause of insertion loss and reflectance. A single dust particle can cause back reflection that disrupts laser sources and increases bit error rates. Always inspect connectors with a scope and clean them before every test. Remember: cleaning is a mandatory step, not an optional precaution. Never assume a connector is clean because it is new or capped.
Macrobends and Microbends
Macrobends occur when the fiber is bent beyond its specified minimum bend radius, causing light to escape. Microbends are tiny distortions in the fiber that also cause loss. These are often induced by improper cable routing, tight cable ties, or excessive tension during installation. In troubleshooting, check for sharp bends, pinched cables, or overly tight fasteners, especially near patch panels and splice trays.
Faulty Splices and Connectors
Poor fusion splices or mechanical splices introduce loss and reflectance. A bad splice may pass a power meter test but fail under stress or at higher data rates. Similarly, connectors that are not properly mated or have damaged ferrules can cause intermittent faults. Always verify splice loss with an OTDR and ensure connectors meet the required insertion loss and return loss specifications.
Common Troubleshooting Mistakes
- Testing without cleaning: Always clean and inspect connectors before testing; otherwise, you may chase a phantom fault.
- Using the wrong test wavelength: Loss varies with wavelength; test at the operating wavelength of the link.
- Ignoring launch conditions: Use launch cables to establish a reference and to avoid measuring the connector at the OTDR port.
- Misreading OTDR events: Distinguish between connectors, splices, and bends by analyzing the event signature—reflective events are connectors or breaks, while non-reflective events are splices or bends.
- Overlooking environmental factors: Temperature, humidity, and vibration can affect both the fiber and the test equipment. Ensure the link is stable during testing.
Procurement Checklist: Buying the Right Components and Tools
Effective fiber optic troubleshooting begins with buying quality components and the right test equipment. A well-planned procurement strategy prevents many issues and simplifies maintenance. Use the following checklist to guide your purchases.
Fiber and Cable
- Specify single-mode or multimode fiber based on your application and distance requirements.
- Choose the appropriate fiber category (e.g., OS2 for single-mode, OM3/OM4 for multimode) that meets your bandwidth needs.
- Ensure the cable jacket is suitable for the environment (indoor, outdoor, plenum, riser).
- Verify the minimum bend radius and tensile strength ratings.
Connectors and Adapters
- Select connector types (LC, SC, ST, etc.) that match your equipment and patch panels.
- Consider pre-polished connectors for field termination to reduce installation errors.
- Buy connectors and adapters from reputable manufacturers to ensure consistent quality.
- Check insertion loss and return loss specifications; typical values are ≤0.5 dB insertion loss and ≥50 dB return loss for single-mode, but always refer to the standard or project specification.
Test Equipment
- Invest in a quality OTDR with appropriate dynamic range and dead zones for your link lengths.
- Use a light source and power meter for insertion loss testing; ensure they are calibrated.
- Include a visual fault locator (VFL) for quick continuity checks and to identify breaks.
- Have a fiber inspection scope with both 200x and 400x magnification to check connector end faces.
- Keep cleaning supplies: lint-free wipes, isopropyl alcohol, and appropriate cleaning tools.
Spares and Documentation
- Stock spare connectors, adapters, and patch cords of the same quality as the installed components.
- Maintain a log of test results and as-built documentation for every link.
- Include a list of approved vendors and part numbers to ensure consistency.
Lifecycle Maintenance: Keeping Fiber Networks Healthy
Fiber optic networks require ongoing maintenance to ensure reliable performance over their lifespan. A proactive maintenance plan reduces the frequency and impact of failures.
Routine Inspection and Cleaning
Schedule periodic inspections of all accessible connectors and patch panels. Clean connectors that show contamination. For inaccessible or rarely used connections, consider sealing them with dust caps to prevent contamination. The frequency of inspection depends on the environment—clean data centers may need only annual checks, while industrial settings may require quarterly inspections.
Performance Monitoring
Implement monitoring systems that track optical power levels and signal quality. For critical links, use remote monitoring to detect degradation before it causes an outage. Set thresholds based on your system’s margin; typical margins are 2-3 dB above the receiver sensitivity, but this varies by design.
Documentation and Record Keeping
Maintain up-to-date records of all test results, repairs, and changes. This documentation is invaluable for troubleshooting and for proving compliance with standards. Update as-built drawings whenever the network is modified.
Training and Procedures
Ensure that all technicians are trained in proper handling, cleaning, and testing techniques. Develop standard operating procedures for troubleshooting and maintenance. Regular training reduces human error and improves response times.
Actionable Recommendations and Conclusion
To minimize downtime and ensure long-term reliability, adopt the following practices:
- Clean before you test: Make it a non-negotiable rule.
- Use the right tools: Invest in quality test equipment and maintain it.
- Document everything: Keep detailed records of installations and tests.
- Train your team: Ensure everyone understands fiber handling and troubleshooting.
- Plan for the environment: Consider temperature, humidity, and physical stress in your design and maintenance.
- Establish a maintenance schedule: Regular inspections and cleaning prevent many issues.
Effective fiber optic troubleshooting is a blend of technical knowledge, disciplined procedures, and the right tools. By understanding common failure modes, avoiding typical mistakes, and implementing a lifecycle maintenance plan, you can ensure your fiber network operates reliably for years. Remember that the primary goal is to maintain signal integrity and minimize downtime—every step you take toward cleaner connections, better documentation, and proactive care contributes to that goal.
Frequently Asked Questions
What are the most common causes of fiber optic link failures?
Common causes include contamination on connector end faces, poor splicing, excessive bending, and physical damage to the cable. Contamination is the leading cause, so proper cleaning and inspection are essential.
How often should fiber optic connectors be cleaned?
Cleaning frequency depends on the environment and usage. In clean data centers, connectors may be cleaned only when they are disconnected and reconnected. In industrial or dusty environments, more frequent cleaning may be necessary. Always inspect connectors before mating and clean if needed.
What is an OTDR and how does it help in troubleshooting?
An Optical Time-Domain Reflectometer (OTDR) sends light pulses into the fiber and measures backscattered light to identify events such as splices, connectors, bends, and breaks. It provides distance and loss information, helping locate faults along the link.
What is the difference between insertion loss and return loss?
Insertion loss is the loss of optical power caused by inserting a component (like a connector) into the link, measured in dB. Return loss indicates how much light is reflected back toward the source, also in dB. Higher return loss (more negative dB) is better, as it means less reflection.
How can I prevent fiber optic cable damage during installation?
Follow manufacturer guidelines for minimum bend radius and tensile load. Avoid pulling cables with excessive force, use proper cable supports, and protect cables from sharp edges. Proper routing and strain relief help prevent micro-bends and stress fractures.
What tools are essential for fiber optic troubleshooting?
Essential tools include a visual fault locator (VFL) for identifying breaks, an optical power meter and light source for loss testing, an OTDR for comprehensive link analysis, and a fiber inspection microscope to check connector end faces for contamination or damage.
Why is it important to inspect connector end faces before mating?
Dirt or scratches on connector end faces can cause high insertion loss and back reflection, and can burn the fiber when high power is transmitted. Inspecting and cleaning before mating ensures optimal performance and prevents permanent damage.
Related In-Depth Guides
Continue with these focused engineering guides: