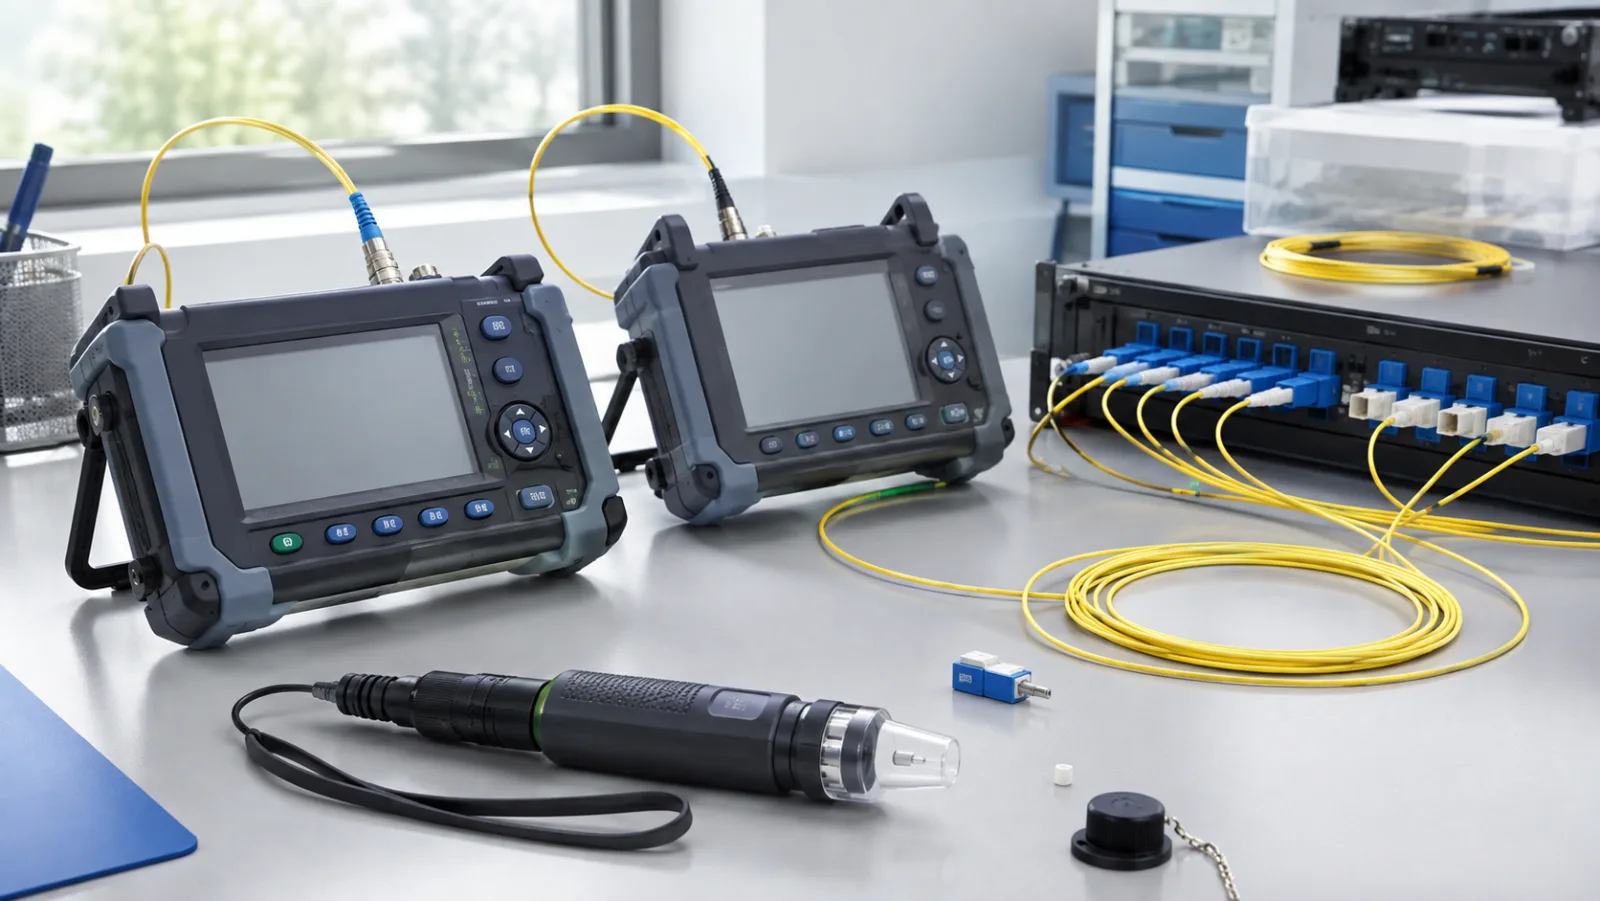
Fiber optic installation testing is the process of verifying that a newly installed or modified optical fiber link meets its performance specifications, ensuring reliable data transmission. It involves measuring parameters such as attenuation, reflectance, and continuity using specialized instruments like optical time-domain reflectometers (OTDRs) and power meters. Proper testing is not optional—it is the only way to confirm that the physical layer will support the intended network services and to prevent costly downtime or troubleshooting later.
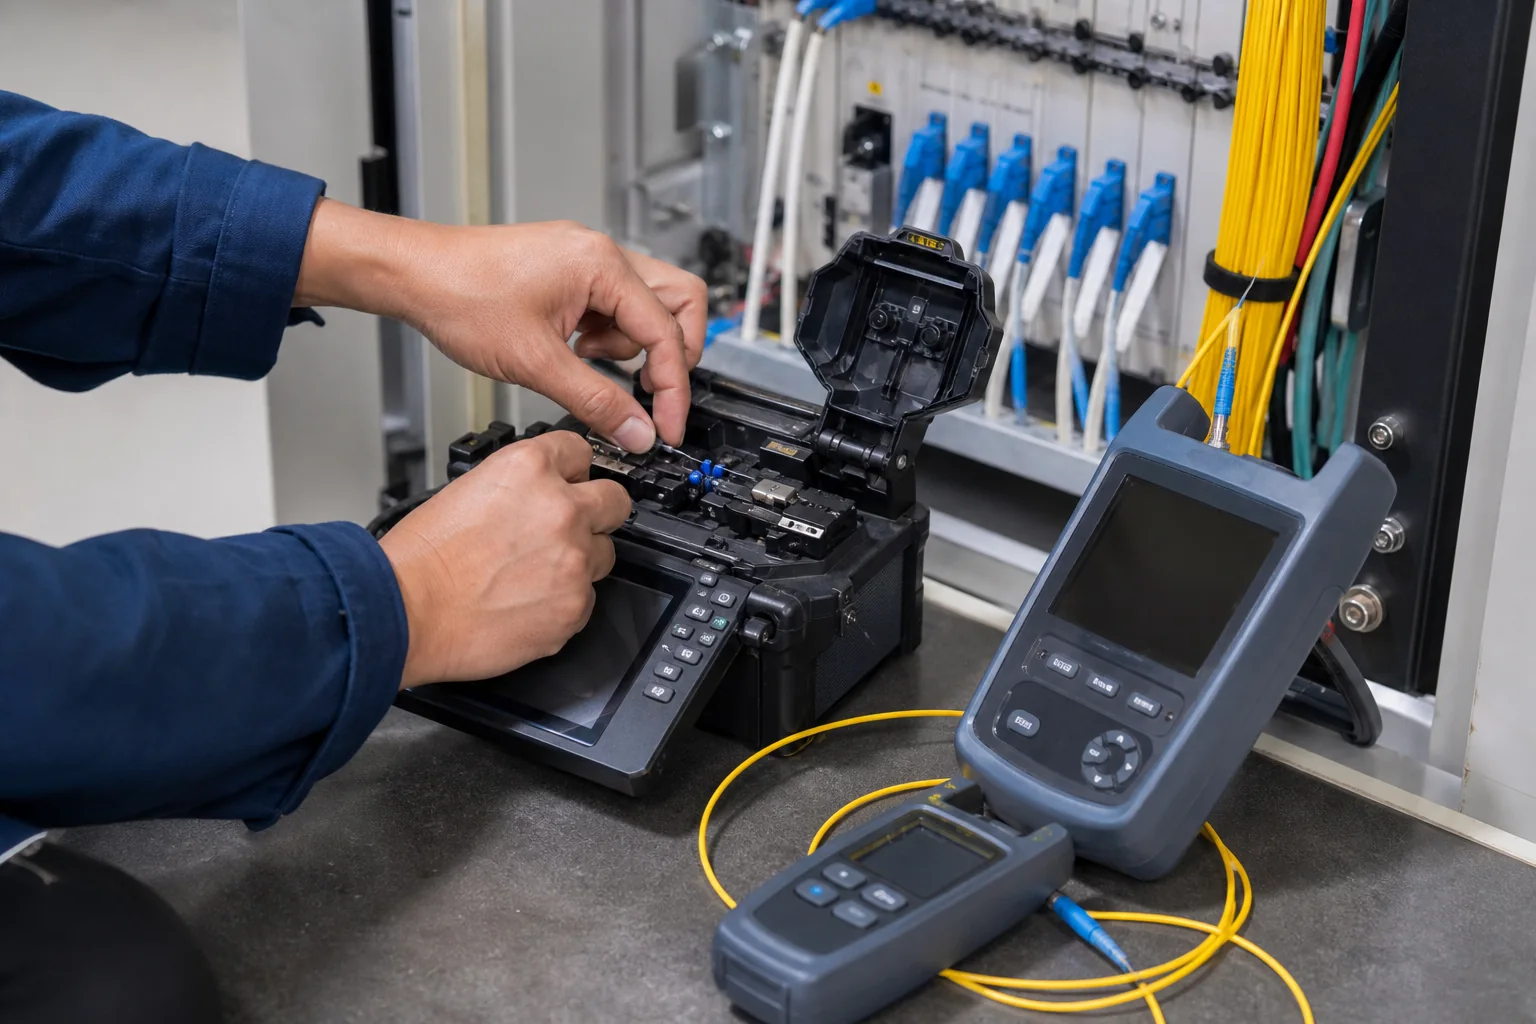
What Is Fiber Optic Installation Testing?
Fiber optic installation testing encompasses a set of measurements and inspections performed during and after the installation of fiber optic cabling. Its purpose is to validate that every splice, connector, and cable segment meets design criteria and industry standards. Without rigorous testing, you cannot know whether the link will perform as expected under real-world conditions.
The scope of testing includes:
- Continuity checks – verifying that light passes through the fiber without breaks.
- Attenuation measurements – quantifying the total optical loss of the link.
- Reflectance measurements – identifying reflections at connectors or splices that can degrade signal quality.
- OTDR analysis – providing a detailed map of the link, showing loss events and their locations.
- Visual inspection – checking connector end faces for dirt, scratches, or other defects.
These tests are performed at various stages: after cable pulling, after splicing, and after connectorization. The results are compared against the design budget and applicable standards to certify the installation.
Why Testing Matters
Fiber optic networks are expected to deliver high bandwidth over long distances with minimal signal loss. A single faulty splice or dirty connector can cause excessive attenuation, leading to bit errors, reduced throughput, or complete link failure. Testing identifies these issues before the network is put into service, saving time and money.
Moreover, many projects require documented test results for acceptance. Clients and certification bodies rely on test reports to prove that the installation meets contractual and regulatory requirements.
Core Terminology and Concepts
To navigate the world of fiber optic testing, you need to be familiar with key terms and units.
Attenuation
Attenuation is the reduction in optical power as light travels through the fiber. It is expressed in decibels (dB). Lower attenuation means better performance. Typical attenuation values for single-mode fiber at 1310 nm are around 0.4 dB/km, and at 1550 nm around 0.25 dB/km, but these are typical values, not guaranteed by all standards. The actual loss depends on fiber type, wavelength, and installation quality.
Insertion Loss
Insertion loss is the loss introduced by a component, such as a connector or splice. It is measured in dB and should be as low as possible. For example, a typical connector insertion loss is 0.5 dB or less, but this is a typical value, not a universal limit. Standards like IEC 61753 define grades for connectors, but the acceptable loss depends on the application.
Return Loss / Reflectance
Return loss (or reflectance) measures the amount of light reflected back toward the source. High reflectance can interfere with laser sources and cause signal distortion. It is expressed in dB, and higher values are better (e.g., a return loss of 50 dB is better than 30 dB). For single-mode connectors, return loss values are often specified as >45 dB for angled physical contact (APC) connectors, but this is a typical specification, not a universal requirement.
OTDR
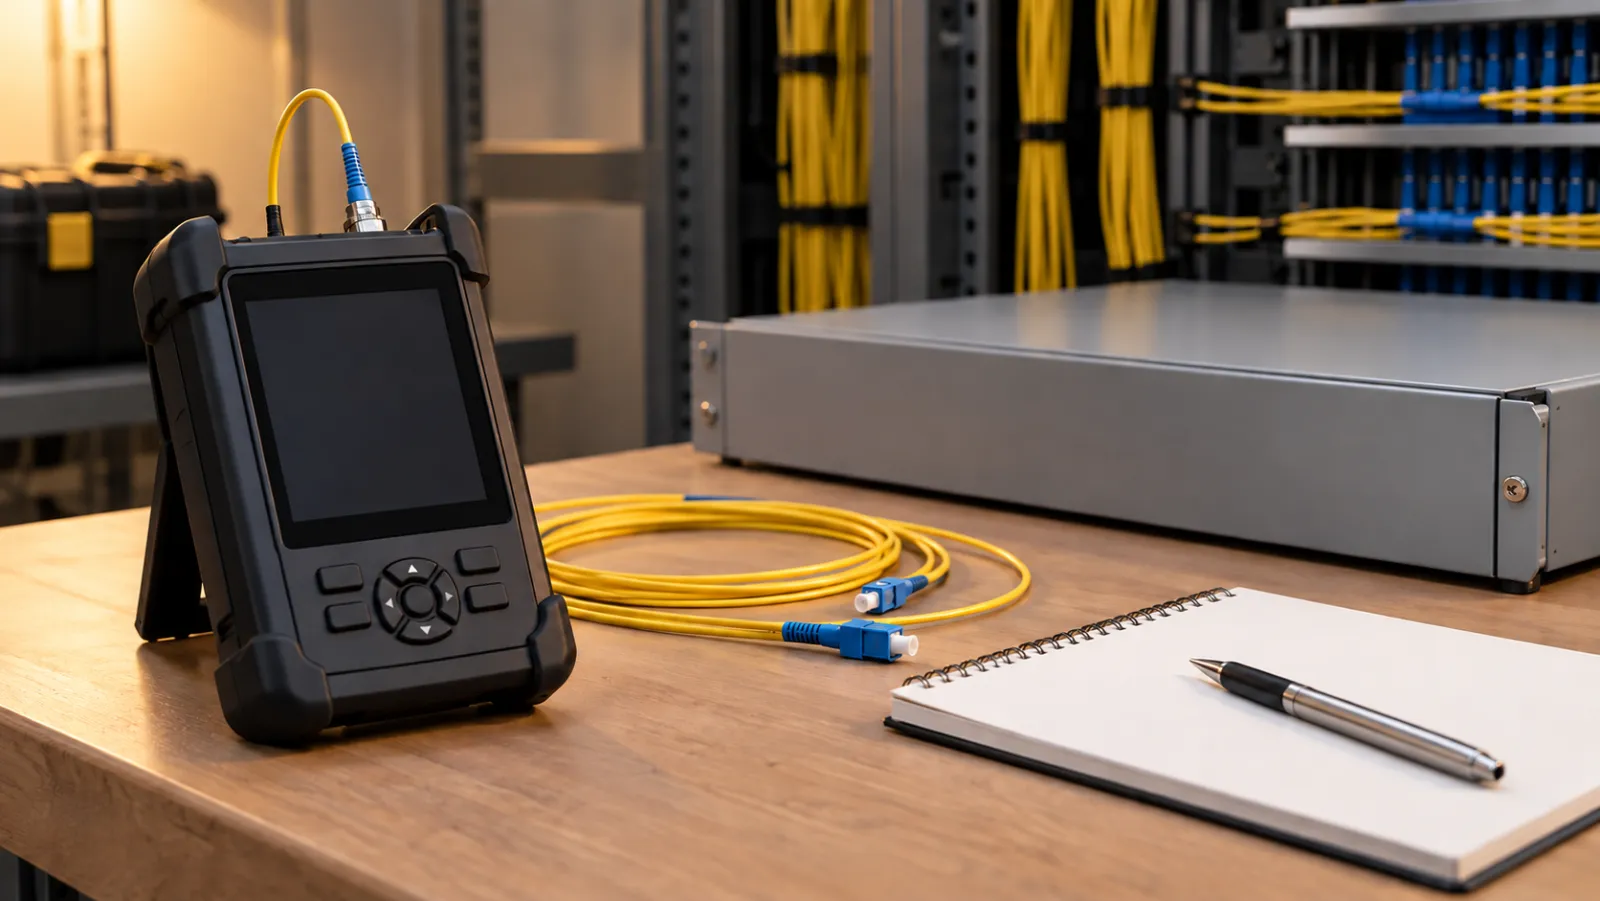
An Optical Time-Domain Reflectometer (OTDR) is an instrument that sends short light pulses into the fiber and analyzes the backscattered light. It provides a graphical trace showing loss and reflectance events along the fiber length. OTDRs are essential for locating faults and characterizing splices and connectors.
Power Meter and Light Source
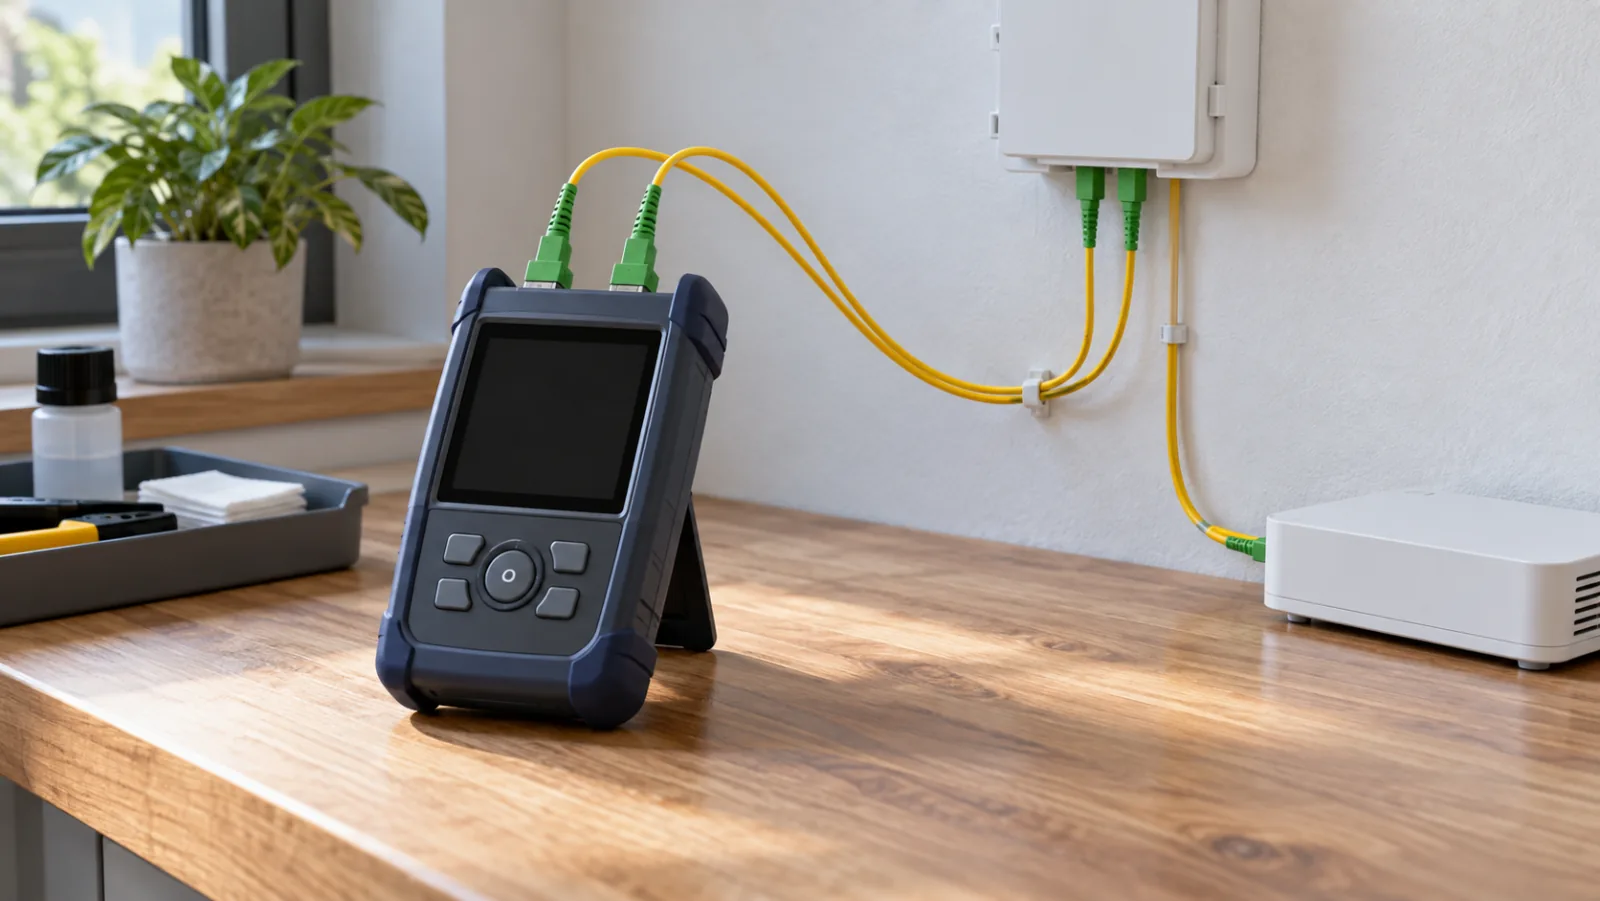
A power meter measures the absolute optical power at a point. When paired with a stable light source, it can measure the total insertion loss of a link. This is the most accurate method for end-to-end loss measurement.
The Role of Testing in Network Performance
Fiber optic installation testing directly impacts the long-term reliability and performance of the network. A well-tested link ensures that the optical signal arrives with sufficient power and quality, allowing the network electronics to operate within their design parameters.
Testing also helps in:
- Validating design assumptions – confirming that the actual loss is within the calculated loss budget.
- Identifying installation defects – such as kinks, excessive bends, or poor splices.
- Providing a baseline – for future troubleshooting and maintenance.
- Ensuring compliance – with standards like TIA-568, ISO/IEC 11801, and others that specify testing requirements.
Standards often mandate specific test methods and pass/fail criteria. For example, TIA-568.3-D requires that installed cabling be tested for attenuation and polarity. However, the exact thresholds may vary based on the application and cable type. It is crucial to refer to the relevant standard for your project.
Key Engineering Decisions You Must Make
Before you begin testing, you need to make several important decisions that will affect the accuracy and validity of your results.
Choose the Right Test Method
There are two primary methods for measuring link loss: the one-jumper reference method and the two-jumper reference method. The one-jumper method is simpler and often used for quick checks, while the two-jumper method eliminates the loss of the test reference cords, providing a more accurate measurement of the installed link. The choice depends on the accuracy required and the standards you are following.
Select Appropriate Test Equipment
Your equipment must be suitable for the fiber type (single-mode or multimode) and the wavelengths used. For example, single-mode testing typically uses 1310 nm and 1550 nm sources, while multimode uses 850 nm and 1300 nm. Ensure your power meter and light source are calibrated and have the correct connectors.
Set Pass/Fail Criteria
You must define what constitutes a passing link. This is usually based on the loss budget calculated from the design. The loss budget accounts for the fiber attenuation, connector losses, splice losses, and a margin for future repairs. Your test results must be within this budget. Additionally, you may need to meet specific reflectance requirements for certain applications.
Plan for OTDR vs. Power Meter Testing
OTDR testing provides a detailed view of the link and can locate faults, but it is not as accurate for measuring total loss as a power meter and light source. Many standards require both: OTDR for troubleshooting and documentation, and power meter for final acceptance. You must decide which tests are necessary for your project and allocate time accordingly.
Document Everything
Proper documentation is essential. Test results should be recorded with details such as date, technician, equipment used, and the exact link tested. This documentation serves as proof of compliance and as a reference for future maintenance. Many organizations use specialized software to generate test reports.
By making these decisions carefully, you ensure that your fiber optic installation testing is effective, compliant, and provides a solid foundation for a reliable network.
Major Fiber Architectures and Their Testing Implications
Fiber optic networks are deployed in several standardized architectures, each with distinct testing requirements. The three dominant types are point-to-point, passive optical network (PON), and wavelength-division multiplexing (WDM) systems. Understanding these architectures is essential for planning fiber optic installation testing, because the test methods and pass/fail criteria differ significantly.
Point-to-Point Links
Point-to-point is the simplest architecture, connecting two endpoints directly with fiber. It is common in data centers, enterprise backbones, and long-haul routes. Testing typically involves measuring end-to-end insertion loss and return loss, and verifying polarity. The main design tradeoff is distance versus loss budget: longer links require lower attenuation or higher transmit power.
Passive Optical Networks (PON)
PON architectures use a passive optical splitter to serve multiple subscribers from a single fiber. The splitter introduces significant insertion loss, which must be accounted for in the loss budget. Testing is more complex because the splitter creates multiple reflection points and makes OTDR traces harder to interpret. Specialized OTDRs with splitter recognition are often used. The key tradeoff is split ratio (e.g., 1:32 vs. 1:64) versus reach and bandwidth per subscriber.
Wavelength-Division Multiplexing (WDM)
WDM systems transmit multiple wavelengths over a single fiber, increasing capacity. Testing must verify that each wavelength channel meets its individual loss and reflectance requirements. Chromatic dispersion and polarization mode dispersion become critical at higher bit rates. The tradeoff is between the number of channels and the complexity of the optical components, which can increase insertion loss and cost.
Architecture Comparison Table
| Architecture | Typical Topology | Key Testing Focus | Main Tradeoff |
|---|---|---|---|
| Point-to-Point | Direct link | End-to-end loss, reflectance | Distance vs. loss budget |
| PON | Star with splitter | Splitter loss, OTDR trace interpretation | Split ratio vs. reach |
| WDM | Point-to-point or ring | Per-wavelength loss, dispersion | Channel count vs. component complexity |
How to Choose an Architecture for Your Project
Selecting an architecture involves balancing cost, scalability, and performance. For short, dedicated links, point-to-point is often simplest and most cost-effective. If you need to serve many users from a single fiber, PON reduces fiber count but introduces splitter loss and shared bandwidth. WDM is ideal for high-capacity backbone links but requires more expensive transceivers and multiplexers.
Consider the following criteria:
- Distance: Longer distances favor lower-loss architectures like point-to-point or WDM with amplification.
- Number of endpoints: PON excels when many endpoints are clustered.
- Bandwidth demand: WDM offers the highest capacity per fiber.
- Testing complexity: Simpler architectures are easier to test and troubleshoot.
- Future scalability: WDM allows adding wavelengths without new fiber.
Always consult the relevant standards (e.g., ITU-T G.652 for single-mode fiber, IEEE 802.3 for Ethernet) to ensure your chosen architecture meets normative requirements for loss and reflectance.
Performance Limits and Design Tradeoffs
Every fiber optic system has intrinsic performance limits that dictate design choices. The most fundamental is the optical loss budget, which is the sum of all connector, splice, and attenuation losses. Standards such as TIA-568 define maximum allowable insertion loss for structured cabling, but these are typical values, not universal limits. The actual budget must be calculated based on your specific components and link length.
Loss Budget Calculation
The loss budget is the difference between the transmitter output power and the receiver sensitivity, minus a safety margin. For example, if a transmitter outputs +3 dBm and the receiver sensitivity is -25 dBm, the total allowable loss is 28 dB. This budget must accommodate all connector losses (typically 0.5 dB per mated pair), splice losses (0.1–0.3 dB per splice), and fiber attenuation (0.4 dB/km at 1310 nm, 0.3 dB/km at 1550 nm for standard single-mode fiber). These are typical engineering values, not guarantees.
Dispersion and Bandwidth
In high-speed systems, dispersion—the spreading of optical pulses—limits the achievable bit rate and distance. Chromatic dispersion is a material property, while polarization mode dispersion is a random effect. Standards like ITU-T G.652 specify maximum dispersion coefficients, but the actual link design must ensure that the total dispersion does not exceed the receiver’s tolerance. This often leads to tradeoffs: using dispersion-compensating fiber or reducing link length.
Reflectance and Return Loss
High reflectance at connectors can cause laser instability and increase bit error rates. Standards typically require return loss of at least 26 dB for single-mode connectors, but some high-performance systems demand 30 dB or more. The tradeoff is that achieving higher return loss requires more precise polishing and more expensive connectors, increasing cost.
Design Tradeoffs
Engineers must balance several competing factors:
- Fiber count vs. cost: More fibers increase cost but provide redundancy and scalability.
- Split ratio vs. reach: In PON, a higher split ratio reduces per-subscriber bandwidth and increases loss, limiting distance.
- Wavelength count vs. complexity: More wavelengths increase capacity but require tighter wavelength control and more expensive multiplexers.
- Testing thoroughness vs. time: Comprehensive testing with OTDR and power meter takes time but reduces future failures.
Ultimately, the design must meet the application’s performance requirements while staying within budget. Fiber optic installation testing validates that the installed system meets these design targets, ensuring reliable operation.
Planning Calculations That Drive Installation Choices
Before pulling cable, the loss budget and mechanical routing must be reconciled with the physical path. A common error is designing a link that meets the loss budget on paper but cannot be installed without exceeding the cable minimum bend radius or pulling tension. The planning phase should therefore include:
- Route survey: measure conduit lengths, count bends, and identify pull points. Each 90-degree bend adds both attenuation and pulling force.
- Fiber count and cable type: choose loose-tube or tight-buffered cable based on environment and installation method. Tight-buffered is common for indoor riser/plenum; loose-tube is typical for outdoor.
- Splice and connector count: every fusion splice and connector contributes to the loss budget. Plan for a small number of spare splices for repairs.
- Testing access: decide where you will launch test equipment. For OTDR testing, you need launch and receive fibers that replicate the connector at the far end.
These decisions directly affect the fiber optic installation testing strategy. For example, if the route has many bends, you may need to use a higher-grade fiber with a lower attenuation coefficient to stay within budget.
Translating the Loss Budget into Installation Tolerances
The loss budget gives you the maximum allowable end-to-end attenuation. During installation, you must track actual losses at each splice and connector. A practical method is to allocate a portion of the budget to installation loss and the rest to the permanent link. For instance, if the budget allows 2.0 dB total, you might allocate 1.5 dB for splices and connectors and 0.5 dB for cable attenuation. This forces you to monitor splice quality in the field.
Typical fusion splice loss for single-mode fiber is around 0.02 to 0.05 dB, while mechanical splices are higher, often 0.2 to 0.5 dB. These are typical values, not standards. The TIA/EIA standards specify maximum link loss but do not dictate splice loss. Always refer to the manufacturer’s specifications for the specific fiber and splice equipment.
Pulling Tension and Bend Radius
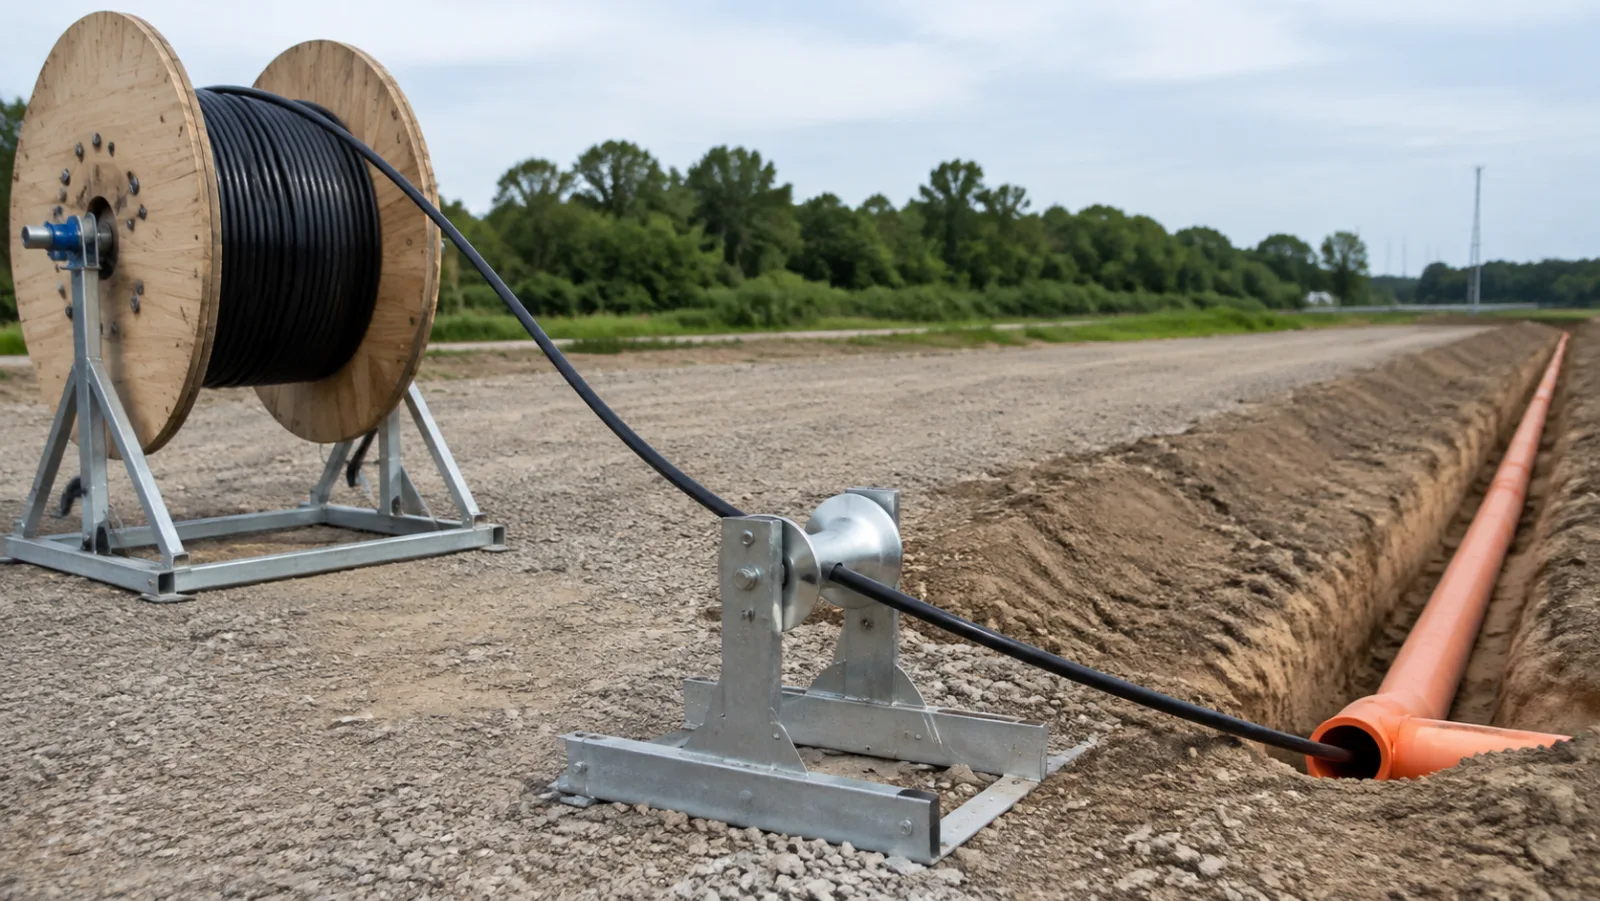
During installation, exceeding the cable’s rated pulling tension or bend radius can cause micro-bends that increase attenuation permanently. The cable manufacturer provides these ratings. A common practice is to use a pulling grip that distributes force over the cable jacket and to use a swivel to prevent twisting. For long pulls, use intermediate pull points to reduce tension.
Also consider the bend radius at corners and entry points. Even if the cable is rated for a 10 cm minimum bend radius, a sharp edge can easily exceed that. Use bend-protection devices or conduits with large-radius sweeps.
Installation Practices That Affect Test Results
The way you install fiber has a direct impact on the results of fiber optic installation testing. Poor practices can introduce loss that is difficult to isolate later.
Cable Routing and Protection
Keep cables away from sharp edges, heat sources, and high-traffic areas. Use cable trays or innerducts. For outdoor runs, ensure proper burial depth and use conduit or armored cable to prevent rodent damage. When pulling, never exceed the rated tension; use a tension meter if possible.
Connector and Splice Preparation
Cleanliness is critical. Dust or oil on a connector endface can cause significant insertion loss and reflectance. Always clean connectors with appropriate wipes and inspect with a scope before mating. For fusion splicing, ensure the cleave angle is within the splicer’s tolerance (typically 0.5 degrees or less).
Labeling and Documentation
Label every fiber, connector, and splice location clearly. This may seem administrative, but it is essential for later testing and troubleshooting. The OTDR trace can identify the exact distance to an event, but without labels you won’t know which physical location that corresponds to.
Testing and Quality Assurance in the Field
After installation, you must verify the link meets the design criteria. This involves both power meter and OTDR testing, each with a specific role.
Power Meter Testing for End-to-End Loss
Use a light source and power meter (LSPM) to measure the total end-to-end loss. This is the ultimate proof that the link meets the loss budget. The test should be performed with the same wavelengths as the system will use (e.g., 1310 nm and 1550 nm for single-mode).
Set the reference correctly: if you are testing a permanent link, use a launch cable and receive cable to zero out the test jumpers. This ensures you are measuring only the installed link, not the test equipment.
OTDR Testing for Fault Location and Splice Quality
An OTDR sends pulses and measures backscattered light to create a trace of the fiber. It can locate breakpoints, high-loss splices, and excessive bends. This is invaluable for troubleshooting. However, OTDR measurements are not the same as end-to-end loss; they measure reflectance and backscatter, which can be affected by the launch conditions.
To get accurate splice loss measurements, use a launch fiber (typically 1000 m or more) to stabilize the pulse. The OTDR should be set to a pulse width that provides adequate resolution for the link length. For short links, a narrower pulse gives better resolution but less range.
Interpreting OTDR Traces
Look for the following on the trace:
- Reflective events: sharp spikes at connectors or mechanical splices. The height indicates reflectance.
- Non-reflective events: dips in the trace at fusion splices or bends. The magnitude of the dip is the splice loss.
- End of fiber: a large drop at the far end. If there is a reflective peak at the end, it indicates a connector; if not, it may be a broken end.
Compare the OTDR-measured splice losses to the expected values. If a splice loss is higher than typical, you may need to re-splice. Remember that OTDR can overestimate or underestimate splice loss due to the direction of the test; always test from both ends if possible.
Documenting Test Results
Record all test results, including the date, tester, equipment, fiber ID, wavelengths, and measured values. Attach OTDR traces to the documentation. This is crucial for warranty and future maintenance. Some standards require documentation for acceptance, so keep it organized.
Practical Field Examples and Caveats
Example: A 2 km Campus Link
Suppose you have a 2 km single-mode link with a loss budget of 3.0 dB. You plan for two fusion splices (one at each end) and two connector pairs (at the patch panels). The cable attenuation is specified at 0.4 dB/km at 1310 nm, so the cable contributes 0.8 dB. The connectors are expected to have 0.5 dB each, so 1.0 dB total. The splices are expected to be 0.03 dB each, so 0.06 dB. Total estimated loss = 0.8 + 1.0 + 0.06 = 1.86 dB, leaving a margin of 1.14 dB.
During installation, you measure the end-to-end loss with an LSPM and get 2.1 dB, which is within budget. But an OTDR trace reveals that one splice has a loss of 0.2 dB, higher than expected. You decide to re-splice that location, and the loss drops to 0.04 dB. This illustrates why both tests are necessary: the LSPM confirms compliance, while the OTDR identifies the problem area.
Caveats and Common Pitfalls
- Don’t rely solely on OTDR for end-to-end loss: OTDR measures backscatter, not the actual light that reaches the receiver. The total loss from OTDR can be misleading if there are reflective events.
- Always use launch and receive fibers: Without them, the OTDR will show a large loss at the first connector that is actually the launch connector, not the link.
- Beware of ghost reflections: In long links, reflections can bounce back and appear as false events. Use a pulse width that minimizes this.
- Clean before every test: Even a clean-looking connector can have microscopic particles. Use a scope to inspect.
- Follow standards but adapt to the field: Standards like TIA-568 set maximum link loss, but they assume proper installation. If your link is longer or has more splices, you may need to exceed those limits, but that should be a deliberate design decision.
In summary, fiber optic installation testing is not a single step but a continuous process from planning to final verification. By integrating loss budget calculations with installation practices and thorough testing, you can ensure a reliable network that meets performance expectations.
Failure Modes and Common Mistakes
Even well-designed fiber links can fail prematurely or underperform when installation practices deviate from the intended tolerances. Understanding the most frequent failure modes helps you target troubleshooting and avoid repeating costly errors.
Mechanical Damage During Installation
The most common cause of field failures is mechanical stress. Exceeding the cable’s minimum bend radius during pulling or routing creates microcracks in the glass, which may not show up immediately but can lead to increased attenuation or fiber breakage under thermal cycling. Similarly, exceeding the maximum tensile load can stretch the fiber, causing permanent signal loss. Always respect the manufacturer’s rated bend radius and pulling tension—these are not suggestions but hard limits.
Contamination and Poor Termination
Dust, oil, or moisture on connector end faces is a leading cause of high insertion loss and intermittent connections. Even microscopic particles can scatter light and cause back reflections. Always clean connectors before mating, and use a scope to inspect the end face if possible. Poor termination—such as over-polishing or under-polishing—can also lead to air gaps or physical contact issues, resulting in unstable links.
Incorrect Splicing and Testing Errors
Splice losses that exceed the budget often stem from misaligned cores or contaminated cleaves. While fusion splicers automate alignment, operator error in fiber preparation remains a factor. In testing, common mistakes include using the wrong launch cable, not setting the reference correctly, or misinterpreting OTDR events. For example, a sharp bend can appear as a splice loss on an OTDR trace, leading to unnecessary rework.
Procurement Checklist for Installation Success
Before you begin any fiber optic installation, a thorough procurement checklist ensures you have the right materials, tools, and documentation. This is not just about buying components; it’s about verifying that they meet your design specifications and are compatible with your testing equipment.
Key Items to Verify
- Cable type and specifications: Confirm the fiber count, single-mode or multimode, and the attenuation coefficient. Ensure the cable jacket rating suits the environment (e.g., plenum, riser, outdoor).
- Connector types and polish: Match connectors to your equipment and patch panels (e.g., LC, SC, UPC, APC). APC connectors are required for high-power or RFoG applications; mixing UPC and APC will cause high loss.
- Pigtails and splice trays: Ensure they are compatible with your cable and splice closures.
- Testing equipment: Have an OLTS (optical loss test set) or power meter and light source, an OTDR, and a visual fault locator. Verify calibration dates and that launch cables are of the correct type and length.
- Cleaning supplies: Include lint-free wipes, isopropyl alcohol, and ferrule cleaners.
- Documentation templates: Prepare test result sheets and labeling materials before installation.
Also, verify that all components meet applicable standards (e.g., TIA/EIA or ISO/IEC) for performance and safety. While standards specify minimum requirements, your project may need tighter tolerances based on your loss budget.
Lifecycle Maintenance and Re-testing
Fiber optic networks are not set-and-forget. Regular maintenance and periodic re-testing help ensure long-term reliability and performance. A proactive approach can identify degradation before it causes downtime.
Routine Inspection and Cleaning
Inspect connector end faces and bulkhead adapters regularly, especially in environments with high dust or humidity. Clean connectors before every mating, and use dust caps when not in use. Physical inspection with a microscope is recommended for critical links.
Periodic Testing
Re-testing intervals depend on the network’s criticality and environment. For example, data centers may test annually, while outdoor plant might be tested every few years or after any disturbance. Use an OTDR to measure link loss and identify any new events, such as increased splice loss or bends. Compare results with baseline documentation from the initial installation.
Documentation Updates
Maintain up-to-date records of all test results, changes, and repairs. This documentation is invaluable for troubleshooting and planning upgrades. It also helps verify that the network still meets the original design specifications.
Actionable Recommendations and Conclusion
To achieve a reliable fiber optic installation, follow these practical recommendations:
- Plan for testing from the start: Design your link with test access points and sufficient slack for testing equipment.
- Train your team: Ensure installers and testers are certified and familiar with the specific equipment and procedures.
- Use quality tools: Invest in calibrated test equipment and proper cleaning supplies.
- Document everything: Label cables and patch panels clearly, and keep test records in a central database.
- Perform a final acceptance test: After installation, run a full end-to-end loss test and an OTDR trace to verify compliance with the loss budget.
In conclusion, fiber optic installation testing is a discipline that spans design, procurement, installation, and maintenance. By understanding failure modes, preparing a thorough procurement checklist, and committing to lifecycle maintenance, you can avoid common pitfalls and ensure a high-performance network. Remember that standards provide a baseline, but your engineering judgment and attention to detail make the difference between a link that merely works and one that performs reliably for years.
Frequently Asked Questions
What are the key steps in fiber optic installation testing?
Key steps include visual inspection, continuity checking, optical loss testing with a light source and power meter, and OTDR testing to verify splice and connector quality.
Why is OTDR testing important in fiber optic installation?
OTDR testing provides a detailed signature of the fiber, identifying events like splices, connectors, bends, and breaks, and measures their loss and reflectance, which is essential for troubleshooting and documentation.
What is the difference between Tier 1 and Tier 2 testing?
Tier 1 testing uses a light source and power meter to measure end-to-end loss and verify polarity, while Tier 2 testing uses an OTDR to characterize individual events and ensure installation quality.
What are typical loss limits for fiber optic cabling?
Typical loss limits are defined by industry standards such as TIA-568, which specify maximum loss per connector (e.g., 0.75 dB) and per splice (e.g., 0.3 dB), but exact values depend on the cabling type and application.
How do I clean fiber optic connectors before testing?
Use a dry cleaning method with a one-click cleaner or lint-free wipes and appropriate solvent, then inspect with a microscope to ensure no contamination remains, as dirty connectors cause high loss and reflectance.
What is the role of a visual fault locator in fiber testing?
A visual fault locator emits a visible laser to trace fibers and identify breaks, severe bends, or bad connectors, which is useful for quick troubleshooting before performing detailed loss or OTDR tests.
How should test results be documented for fiber optic projects?
Documentation should include a cable plant diagram, test equipment and settings, measured loss values, OTDR traces, and pass/fail criteria, providing a record for acceptance and future maintenance.
Related In-Depth Guides
Continue with these focused engineering guides: