Summary: The distinction between OTDR event vs attenuation dead zone determines whether a tester can merely detect a second nearby event or accurately measure its loss. Compare specifications only under matching pulse-width and reflectance conditions, then add practical spacing margin.
The distances below are hypothetical planning values. Actual dead zones depend on the instrument, module, wavelength, pulse, reflection and analysis definition; verify the exact data-sheet footnotes.
Understand what blinds the detector
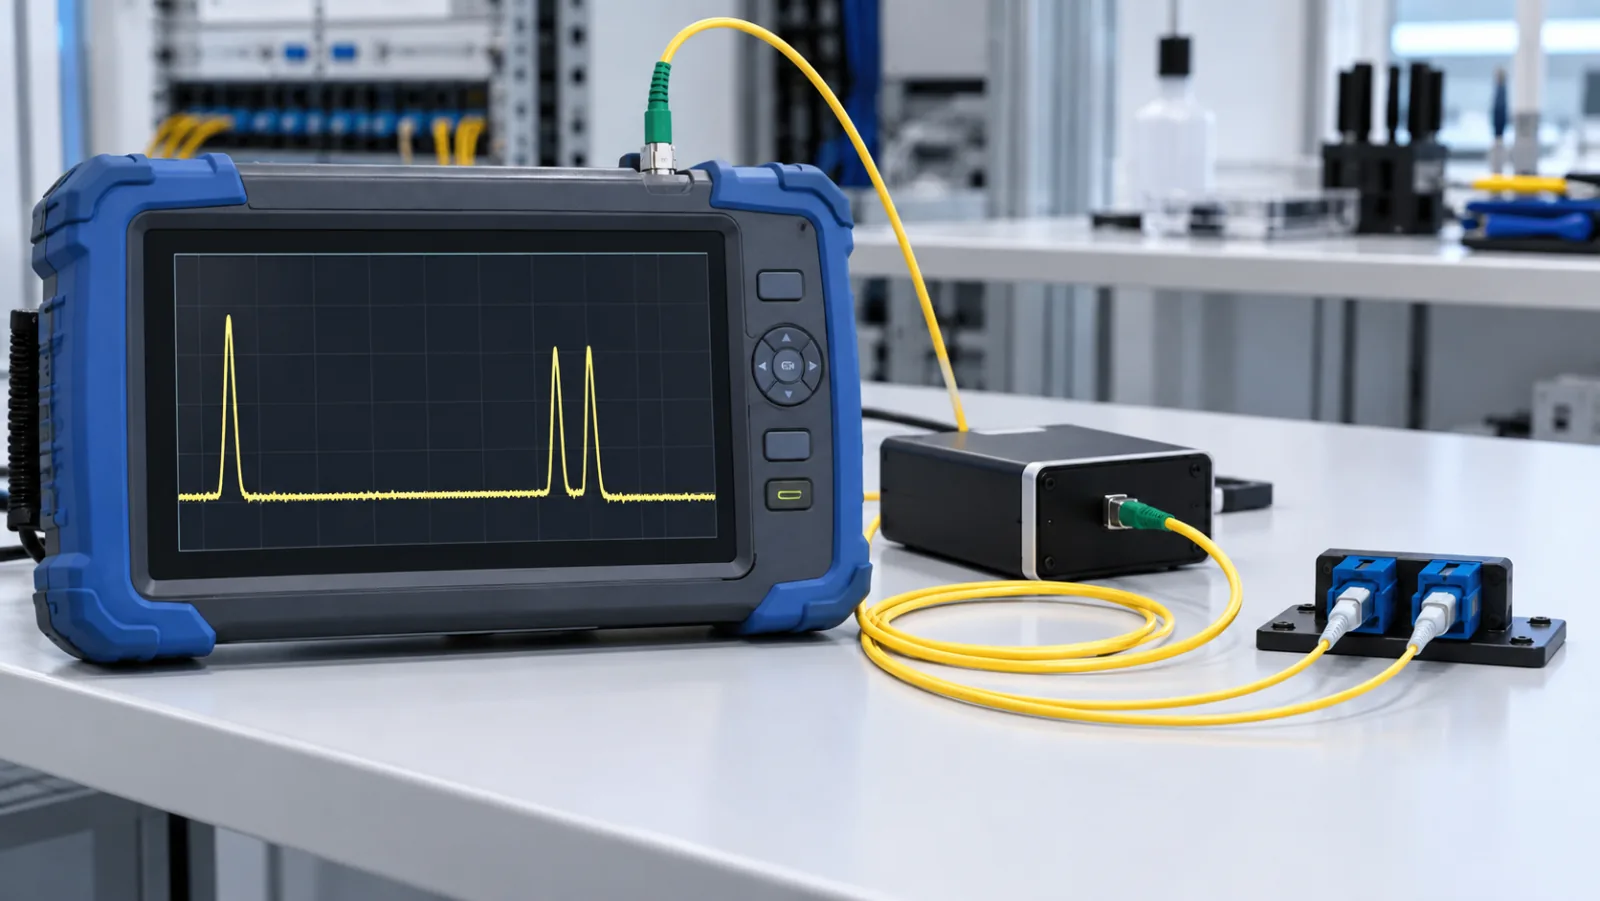
A strong Fresnel reflection can temporarily saturate or blind the OTDR receiver. EXFO’s dead-zone glossary describes the resulting blind region after a reflective event. Open connectors, mechanical interfaces and strong reflective faults can produce it.
Reducing reflectance through clean, properly mated connectors helps trace quality but does not eliminate the need to design around the instrument specification. A non-reflective splice does not create the same recovery behavior as a large Fresnel peak.
Use event dead zone for detection spacing
Event dead zone is the minimum separation after a reflection at which another event can be distinguished under the stated test conditions. It answers “can the OTDR see two events?” rather than “can it accurately measure the loss of the second one?”
EXFO’s OTDR testing overview defines event dead zone as the minimum distance after a Fresnel reflection at which another event can be detected. This matters in short links with closely spaced patch-panel connections.
Use attenuation dead zone for loss measurement
Attenuation dead zone is longer because the backscatter level must recover sufficiently for an accurate loss estimate. EXFO’s OTDR fundamentals guide explains both definitions and notes that quoted performance depends on pulse width and reflection conditions.
If the design needs a numeric loss for a second connector, compare its spacing with attenuation dead zone plus a project margin. If only location or presence is needed, event dead zone may be the relevant criterion. State which outcome the acceptance test requires.
Include launch and receive arrangements
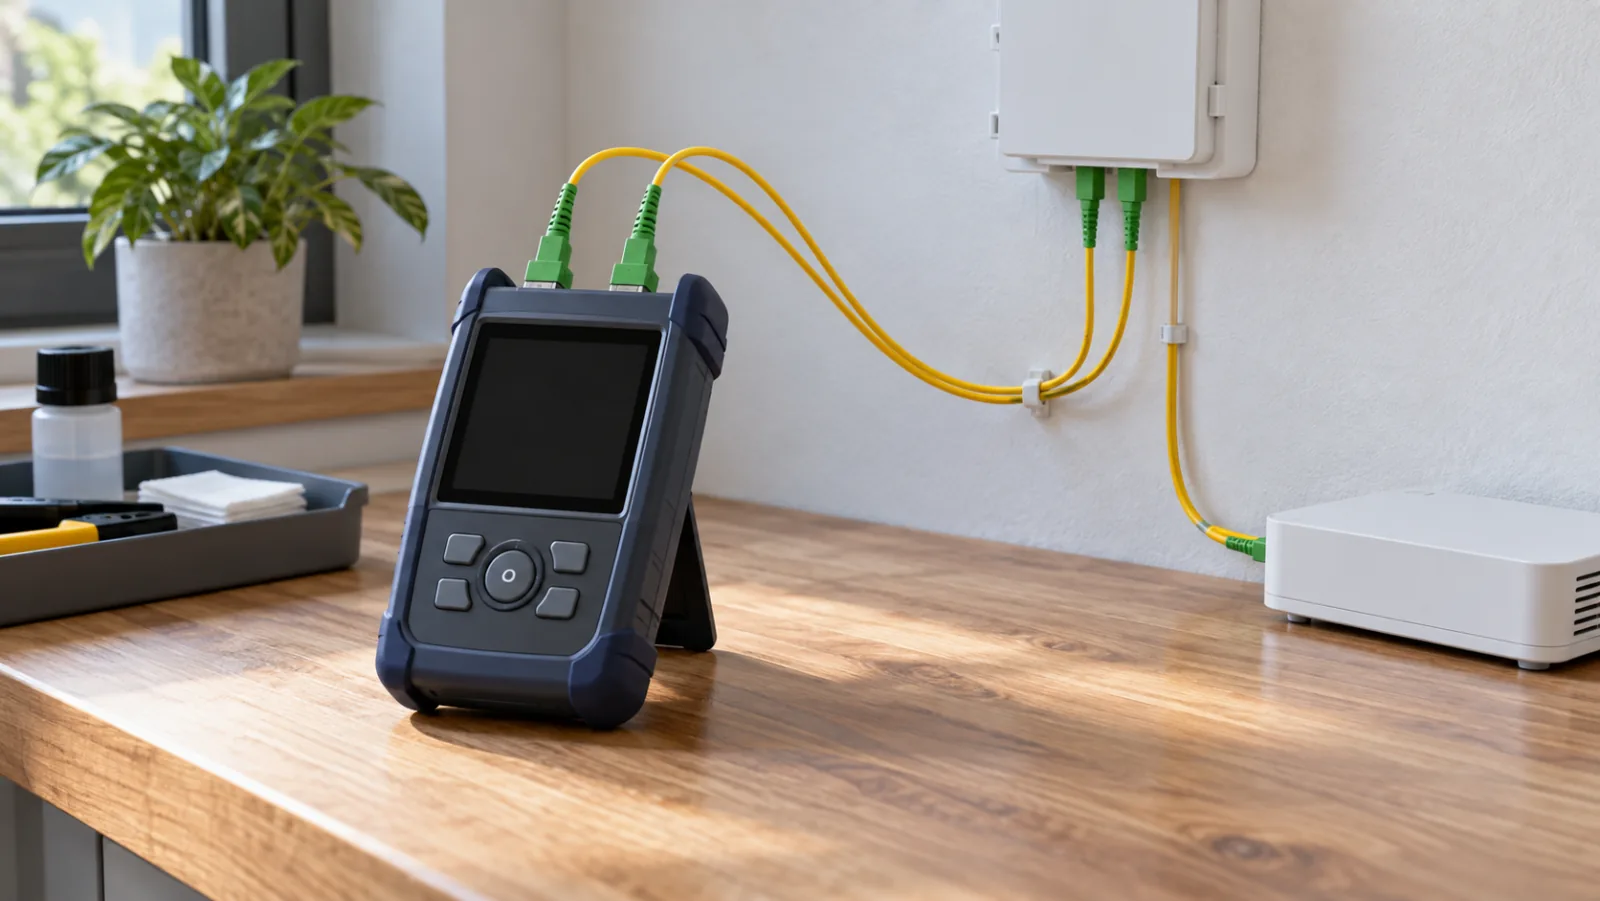
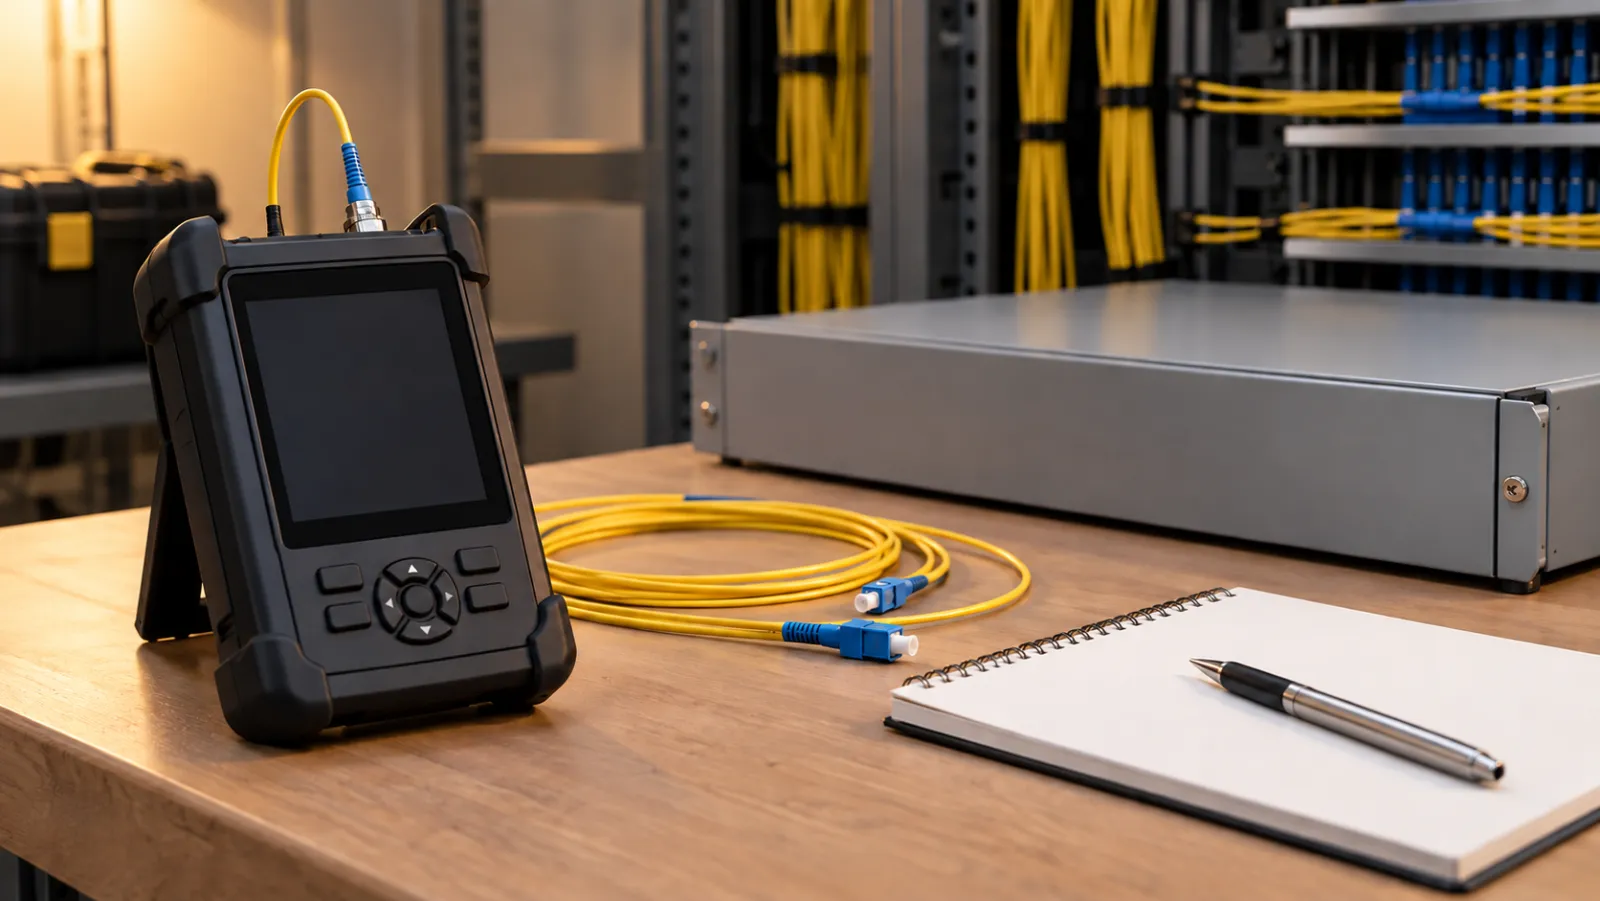
A launch fiber moves the first link connector beyond the OTDR port dead zone; a receive fiber provides backscatter after the final connector. Their connector type, fiber type and length must match the test plan. Our OTDR launch-cable length guide covers those boundaries.
Pulse width trades spatial resolution against reach. The shortest pulse often yields the best dead-zone specification but may not supply enough dynamic range for a long or highly lossy route. Use our OTDR pulse-width guide to plan more than one acquisition when necessary.
Close-event spacing worksheet
Assume a data sheet, under matching stated conditions, gives a 1.0 m event dead zone and 4.0 m attenuation dead zone. Two adapters are separated by 3.0 m of fiber.
| Question | Required spacing | 3.0 m result |
| Detect second event | > 1.0 m plus margin | Potentially yes |
| Measure second-event loss | > 4.0 m plus margin | No |
| Change to short pulse | Recheck noise and reach | May improve spacing |
| Final decision | Validate with representative setup | Do not infer accuracy |
The example shows why “visible” is not equivalent to “measurable.” Do not transfer these distances to another OTDR or reflection level.
Write the requirement before requesting evidence
Start with the exact product, application and document revision. State the sample configuration, environmental or optical conditions, measurement points, units and required report fields. Identify the acceptance value and whether it applies per fiber, per channel, per cable sample or to a statistical lot. A standard method and a project limit are different things: cite the method that governs the procedure and the specification that supplies the pass/fail value.
On the commercial fiber optic tools page, provide these details with the inquiry. This lets a proposed construction and test plan be reviewed against the intended deployment. Do not assume a broad product-family description proves compliance for every design option.
Control samples, instruments and revisions
Give every sample and fiber a traceable identifier. Record cable marking, length, conditioning, termination method and any preparation that could influence the result. Instrument records should include model, serial number, calibration status, wavelength, reference method, settings and raw file name. If a setup changes during the sequence, document the change rather than combining unlike readings silently.
Use approved documents at the work station and archive superseded versions. Review drawings, purchase requirements and manufacturer instructions before starting. Where they conflict, stop and obtain a written disposition. This protects both buyer and supplier from judging a test by a limit that was introduced after the sample was prepared.
Apply a reproducible decision rule
Define rounding and measurement uncertainty before results are known. A displayed value at the limit can represent raw values on either side of it. Preserve additional digits in the record, then apply the agreed rounding or guard-band rule once. Repeating a measurement only until it passes is not a valid process; repeats need a stated trigger and all valid observations should remain in the file.
When a result fails, first verify identity, setup integrity, reference stability and data transcription. Then follow the approved route: retest, inspect, rework, reject or request engineering review. The record must distinguish a confirmed product nonconformance from an invalid test. Neither should be hidden by averaging unrelated samples.
Preserve a useful delivery record
A complete report contains the requirement, procedure, sample description, apparatus, conditions, chronological readings, calculation, uncertainty rule, decision and authorization. Native instrument files and photographs may support the report, but screenshots and photos do not replace numeric evidence. Mark hypothetical worksheets as examples so they cannot later be mistaken for factory results.
Keep incoming, pre-installation and post-installation checks separate. Transport, storage and field handling occur after factory release and can alter condition. If the asset is repaired or rerouted, update its configuration record and create a new baseline using the same method where practical. A clean change history makes later troubleshooting faster and supports fair warranty discussions.
Common errors and safety boundaries
Do not compare one vendor’s dead-zone number at a weak reflection with another vendor’s number at a stronger reflection. Avoid selecting only the shortest pulse for a long PON, reading events inside saturation as precise losses, or omitting receive-fiber coverage of the final connector.
Never copy a limit from a visually similar cable or instrument without checking construction, wavelength, reference condition and standard edition. Follow site rules for invisible laser radiation, sharp fiber fragments, pressurized apparatus, environmental chambers and electrical equipment. Qualified personnel should use the manufacturer’s safety instructions and the project risk assessment.
Plan the sampling and witness process
State whether the evidence is a design qualification, periodic type test, production sample test or inspection of the delivered lot. These categories are not interchangeable. Define lot boundaries, sample quantity, selection method and what happens to the remainder of a lot when one sample fails. If testing is destructive or changes the sample, mark it so it cannot return to saleable stock unnoticed.
Where a customer witness is required, agree the date, language, remote-view arrangements and hold points in advance. A witness observes the approved procedure; the witness should not improvise new limits after testing begins. Record deviations and obtain signatures from the authorized representatives.
Check report completeness before release
Use an independent review to compare the report against the purchase order. Confirm that identifiers, units, wavelength, environmental conditions, calculations and pass/fail statements agree across the cover page and raw data. Verify that attachments open and that photographs show the intended sample without exposing confidential information.
The reviewer should also confirm that a statement of conformity does not extend beyond the tested configuration. A result on one cable length, instrument module or connector arrangement cannot silently qualify every variant in a catalogue. Release the report only after discrepancies are corrected or formally explained, then retain it according to the project’s record policy.
Record the final approval date and the person or organization authorized to release the result.
Frequently Asked Questions
Which OTDR dead zone is shorter?
Event dead zone is normally shorter because detecting a second event requires less detector recovery than accurately measuring its loss.
Can an event be visible but have no reliable loss value?
Yes. It may lie beyond event dead zone but still inside attenuation dead zone.
Does a shorter pulse always solve dead-zone problems?
No. It improves resolution but reduces launched energy and may provide insufficient dynamic range for the route.
Why do reflectance footnotes matter?
A stronger reflection takes longer to recover from, so dead-zone results are not comparable unless test conditions match.
Can a launch cable remove every dead zone?
No. It enables measurement of the first connection, but reflective events within the link still create their own recovery regions.